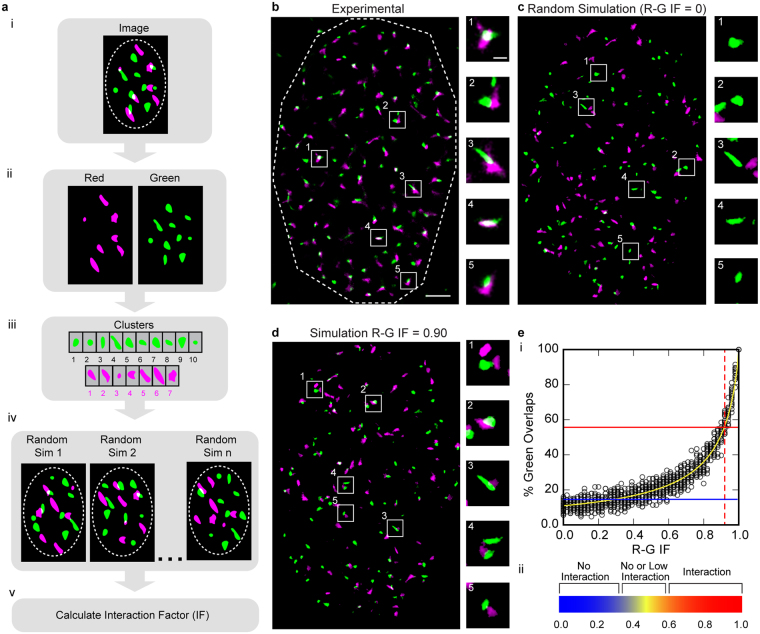
Figure 1.
The Interaction Factor (a) Schematic of the algorithm workflow. (a–e) For illustration purposes, the color red is represented as magenta. (a, i) Segmented two-color fluorescence microscopy (RGB) image of cell nucleus. ROI is outlined in dashed line. (a, ii) Color channels are separated. (a, iii) Clusters within the ROI are obtained from the segmented images. (a, iv) A simulation is created by placing clusters in random locations within the ROI. This process is repeated and the probability of green clusters (reference color) overlapping with red clusters is measured. (a, v) The probabilities are used to predict the IF (Equation 1). (b) Super resolution image (SMLM) of nucleus stained for two different proteins red and green. Dashed line indicates ROI, nucleus. Scale bar = 2μm. Boxes (1–5) point to clusters magnified in right column. Scale bar = 500 nm. (c) Simulation generated from clusters of experimental image (b) for IF = 0. Boxes point to same green clusters as experimental image (b) magnified in right column. (d) Simulation generated from clusters of experimental image (b) for Red-Green (R-G) IF = 0.90 (reference color = green). Boxes point to same green clusters as experimental image (b) magnified in right column. (e) The R-G IF curve. (e, i) Plot showing percentage of green cluster overlap for simulations generated with different R-G IFs. The yellow curve is a plot of its analytical prediction; points indicate values for individual simulations (n = 20 simulations per IF). The percentage of green overlaps for the experimental image (b) was 56% (red line) resulting in a predicted R-G IF of 0.92 according to Equation 1. For a theoretical image with 15% green overlaps (blue line), Equation 1 predicts R-G IF = 0.22 (e, ii) Heat map that can be used as a guide to understand the meaning of the IF at different levels.

