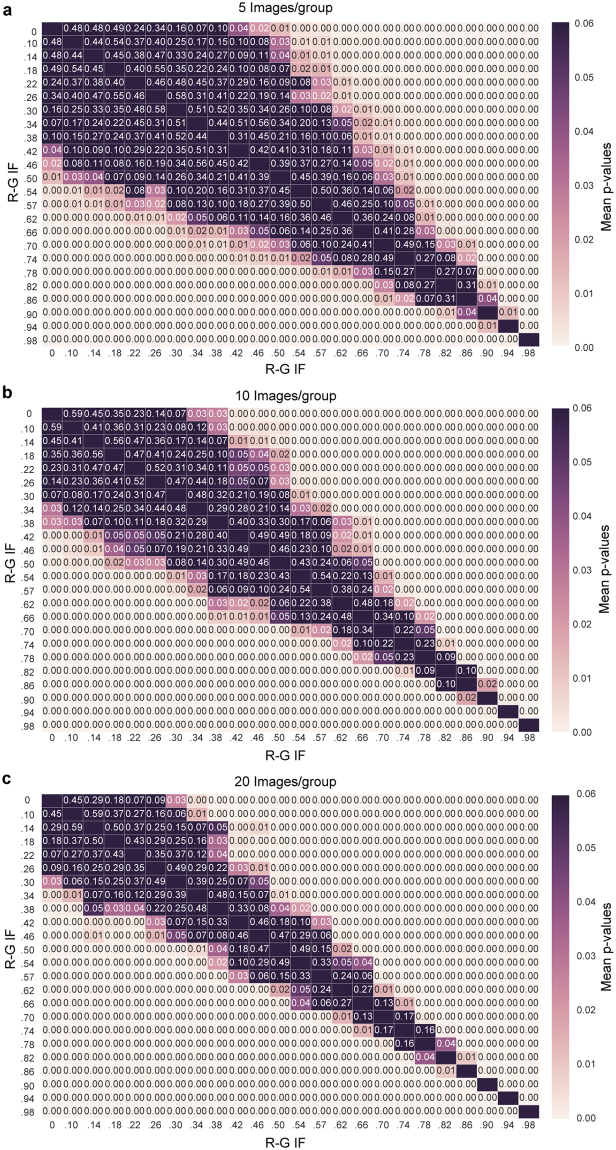
Figure 3.
Statistical significance of R-G IF with different data sizes (a) A heat map showing the mean Student’s t-test p-value that resulted from the comparison of the calculated R-G IFs of simulated experimental groups with 5 images/group for a range of R-G IFs (values indicate the mean p-value for 20 comparisons). (b) A heat map showing the mean Student’s t-test p-value that resulted from the comparison of the calculated R-G IFs of simulated experimental groups with 10 images/group for a range of IFs (values indicate the mean p-value for 20 comparisons). (c) A heat map showing the mean Student’s t-test p-value that resulted from the comparison of the calculated R-G IFs of simulated experimental groups with 20 images/group for a range of R-G IFs (values indicate the mean p-value for 20 comparisons).

