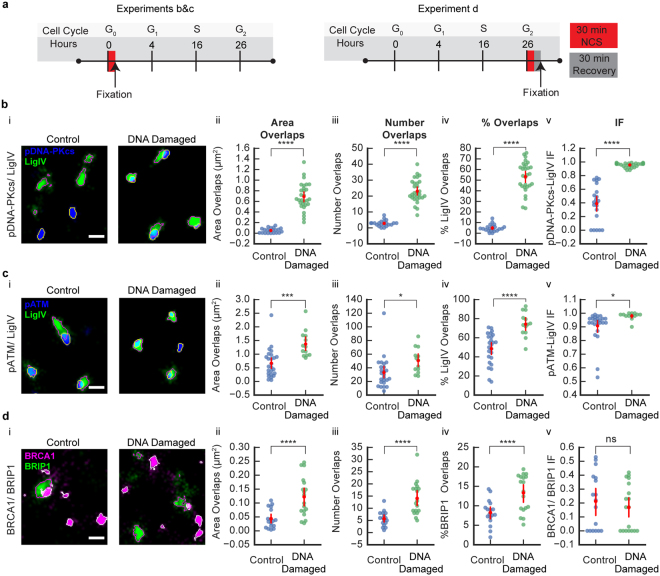
Figure 4.
Comparison of the R-G IF for SMLM images of U2OS cell nuclei labeled for proteins involved in NHEJ and HR (a) A schematic of the experimental timeline for NCS treatment and fixation of U2OS cells quantified in part b&c (left) and part d (right). (b, i) pDNA-PKcs and LigIV. Examples of an area of SMLM images of U2OS cells in control (left) and after NCS treatment (DNA-damaged; right) labeled for LigIV (green; outlined magenta: segmented clusters) and pDNA-PKcs (blue; outlined yellow: segmented clusters). Scale bar = 400 nm. (b, ii) Area of overlaps between pDNA-PKcs/LigIV was greater in DNA-damaged compared to control group. (b, iii) Number of overlaps between pDNA-PKcs/LigIV was greater in DNA-damaged compared to control group. (b, iv) Percentage of LigIV clusters overlapping with pDNA-PKcs was greater in DNA-damaged compared to control group. (b, v) IF between pDNA-PKcs/LigIV was greater in DNA-damaged compared to control group. Groups: control (n = 21); DNA-damaged (n = 29). (c, i) pATM and LigIV. Examples of an area of SMLM images of U2OS cells in control (left) and after NCS treatment (DNA-damaged; right) labeled for LigIV (green; outlined magenta: segmented clusters) and pATM (blue; outlined yellow: segmented clusters). Scale bar = 400 nm. (c, ii) Area of overlaps between pATM/LigIV was greater in DNA-damaged compared to control group. (c, iii) Number of overlaps between pATM/LigIV was greater in DNA-damaged compared to control group. (c, iv) Percentage of LigIV clusters overlapping with pATM was greater in DNA-damaged compared to control group. (c, v) IF between pATM/LigIV was greater in DNA-damaged compared to control group. Groups: control (n = 25); DNA-damaged (n = 13). (d, i) BRCA1 and BRIP1. Examples of an area of SMLM images of U2OS cells in control (left) and after NCS treatment (DNA-damaged; right) labeled for BRIP1 (green; outlined magenta: segmented clusters) and BRCA1 (magenta; outlined white: segmented clusters). Scale bar = 400 nm. (d, ii) Area of overlaps between BRCA1/BRIP1 was greater in DNA-damaged compared to control group. (d, iii) Number of overlaps between BRCA1/BRIP1 was greater in DNA-damaged compared control group. (d, iv) Percentage of BRIP1 clusters overlapping with BRCA1 was greater in DNA-damaged compared to control group. (d, v) IF between BRCA1/BRIP1 was not significantly different after DNA-damage compared to control group (n.s. = not significant; p > 0.05). Groups: control (n = 17); DNA-damaged (n = 18). (b–d) Error bars represent 95 CI. *p < 0.05, ***p < 0.001 ****p < 0.0001 by t-test.

