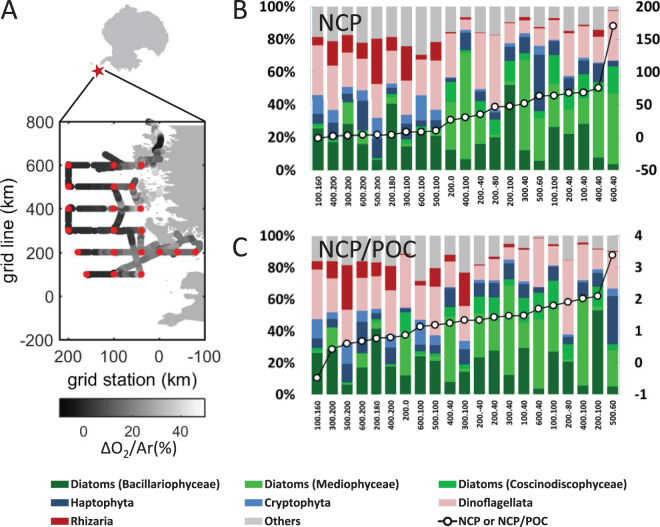
Figure 1.
Eukaryotic plankton community composition of major taxonomic groups versus NCP. (A) Location of the Western Antarctica Peninsula and sampling sites (red dots) projected on Palmer LTER grid (x axis – grid station, y axis – grid line, in km). Samples were taken across a large gradient in biological O2. Stations (labeled as “grid line. grid station”) are ranked in ascending values of NCP (black circles) (B) in mmol C m−2 day−1, and (C) NCP/POC in m day−1. The relative abundance of different taxa (Phylum to Division) in % of 18 S reads are represented in different colors. Centric diatoms (Mediophyceae and Coscinodiscophyceae) are in light greens, whereas pennate diatoms (Bacillariophyceae) are in dark green. Less dominant taxa (<5% in total abundance) are combined into ‘others’ in grey. The maps in this figure are generated by MATLAB R2014a (http://www.mathworks.com/).

