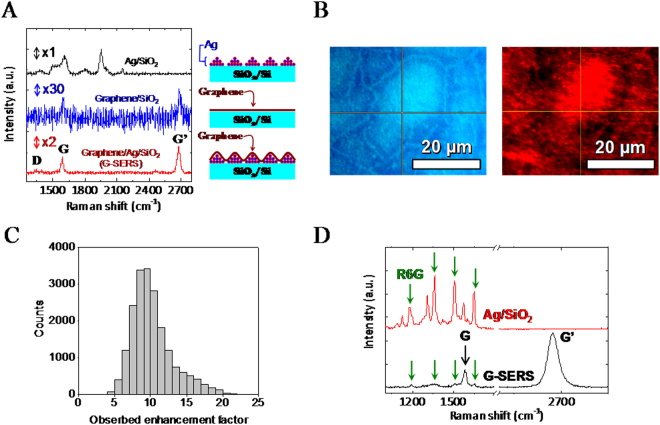
Figure 2.
Enhancement of Raman peaks by G-SERS substrate. (A) Raman spectra of Ag/SiO2/Si (black), graphene/SiO2/Si (blue), and graphene/Ag/SiO2/Si (red). The number located above each spectrum shows magnifications for the intensity scale. Schematic illustrations for each sample are also shown. (B) Optical microscope image (left) and G’ peak intensity map (right) of G-SERS. (C) Histogram of the observed enhancement factor of G’ peak intensity. (D) Raman spectra of R6G/G-SERS (black) and R6G/Ag/SiO2/Si (red).

