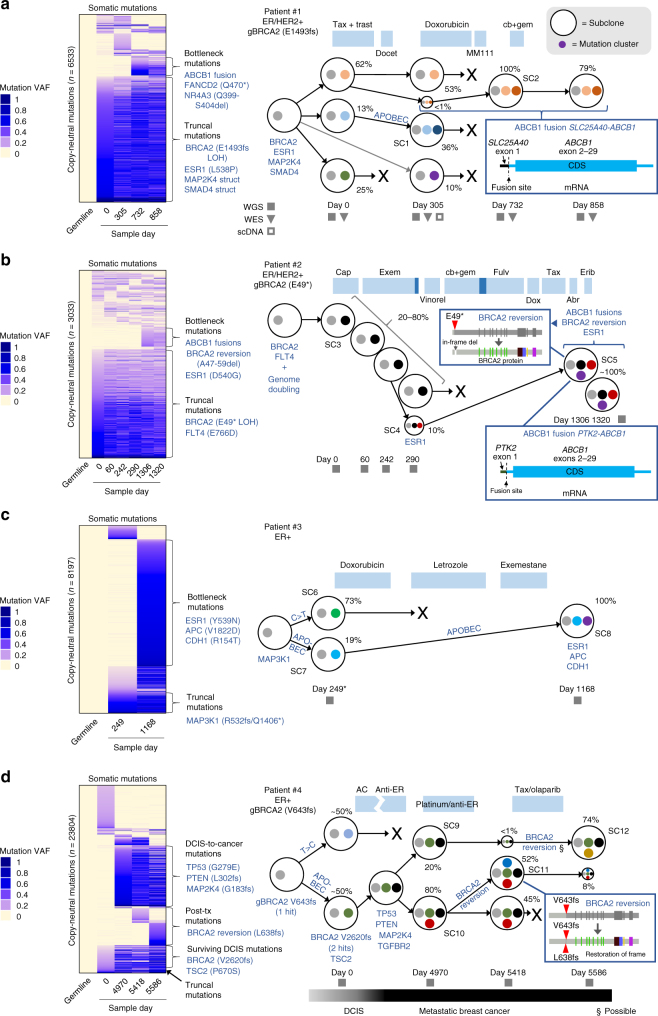
Fig. 2.
Subclonal evolution of four breast cancers over 2–15 years. a–d Subclonal evolution of breast cancer patients #1 to #4 through treatment. Left side shows variant allele frequencies of copy-neutral somatic SNVs and indels (WGS) organized into clusters, with relevant cancer-associated mutations (may or may not be copy-neutral and includes structural variants) indicated. Right shows subclone evolution. Subclones are indicated by large circles; mutation clusters are indicated by small colored circles. Relevant mutations in subclones are indicated by text or boxed insets. CCF is indicated as percent next to subclone. Filled squares indicate timepoints sequenced by whole-genome sequencing (WGS), filled inverted triangles indicate whole-exome sequencing (WES), and empty squares indicate targeted single-cell DNA sequencing (scDNA). Abr, Abraxane; cap, capecitabine; cb, carboplatin; dox, doxorubicin; erib, eribulin; exem, exemestane; fulv, fulvestrant; gem, gemcitabine; Tax, paclitaxel; trast, trastuzumab; vinorel, vinorelbine. *Patient #3 day 0 had RNA-Seq only. gBRCA2 indicates a germline BRCA2 mutation

