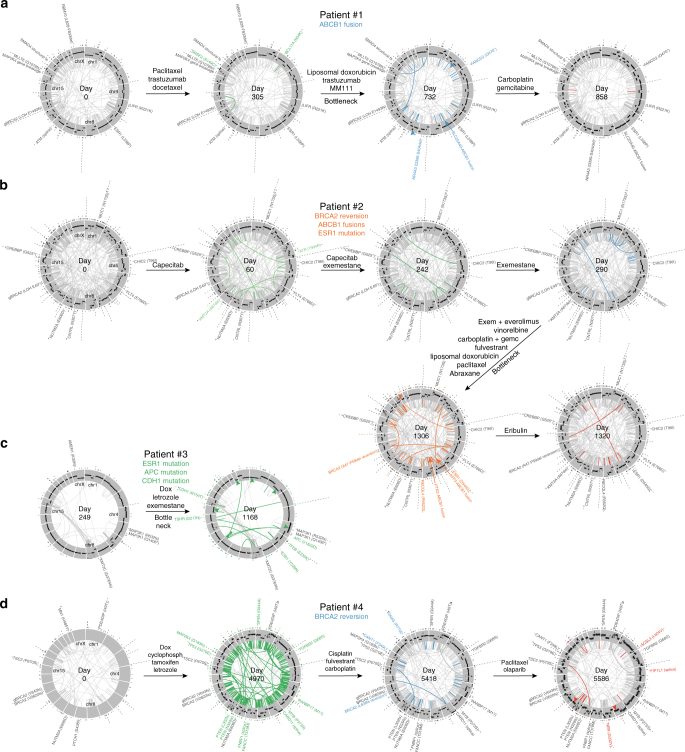
Fig. 3.
SNV, structural variant, and CNA evolution in four breast cancers. a–d Circos plots showing mutation evolution of breast cancer patients #1 to #4 through treatment. Each circle represents chromosomes 1 through X (clockwise from top) arranged in a circle. Protein-coding somatic SNVs and indels are indicated outside each circle as ticks or, for Cancer Gene Census genes, by name. Germline BRCA2 mutations are indicated as “gBRCA2.” Structural variants (large deletions, translocations, inversions, and duplications) are indicated inside each circle as a line joining the start and end of the variant, with Cancer Gene Census gene mutations indicated outside. Copy number changes are represented in the gray region with higher copy towards the outer edge. Newly appearing SNVs, indels, and structural variants are shown in color, while selected newly appearing CNAs are indicated by colored arrows. CNAs were not determined in the patient #4 day 0 sample due to technical issues with FFPE samples

