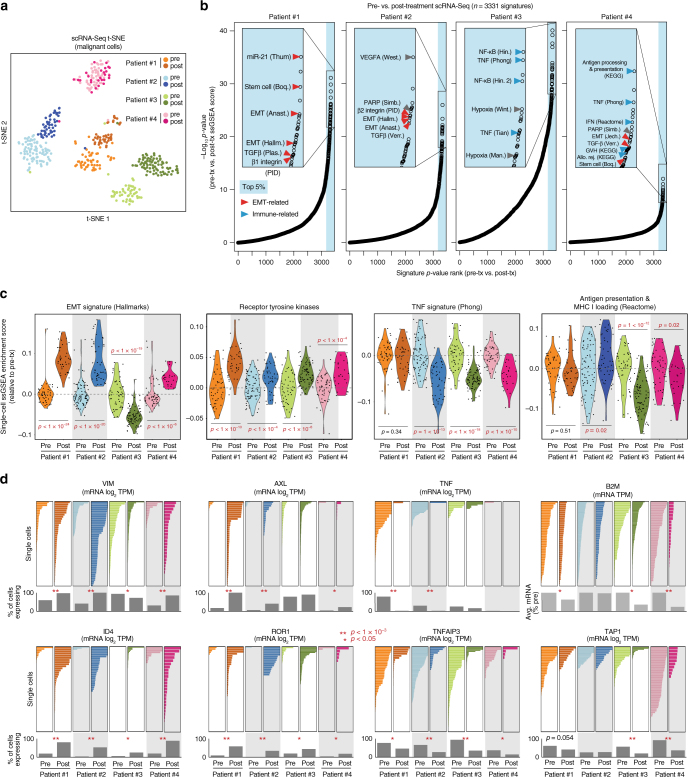
Fig. 5.
Single-cell RNA-Seq of pre- and post-treatment breast cancers reveals increased immune-avoidance, EMT, and RTK phenotypes. a t-SNE analysis of 428 individual cells’ expression profiles from pre- and post-treatment breast cancer samples from four patients. b Plots of P-values (t-test-derived) comparing ssGSEA enrichment scores for 3331 C2 signatures between pre- and post-treatment single cells in each patient. x-axis, P-value ranks (higher ranks are more significant); y-axis, −log10(P-value). Red arrows, EMT- and stem cell-related signatures; blue arrows, immune-related signatures. c ssGSEA enrichment score (relative to pre-treatment average) violin plots for single cells in each sample for indicated signatures. Each point represents a single cell. P-values are by Student’s t-test (two-tailed). d Expression of indicated genes by scRNA-Seq (x-axis) in individual cells (y-axis) with percent of cells expressing each gene or average expression indicated below in gray bars. P-values are by two-sample proportion test. *P < 0.05. **P < 1 × 10⁻³. x-axis scales all begin at zero (left) and are the same within patients for each gene

