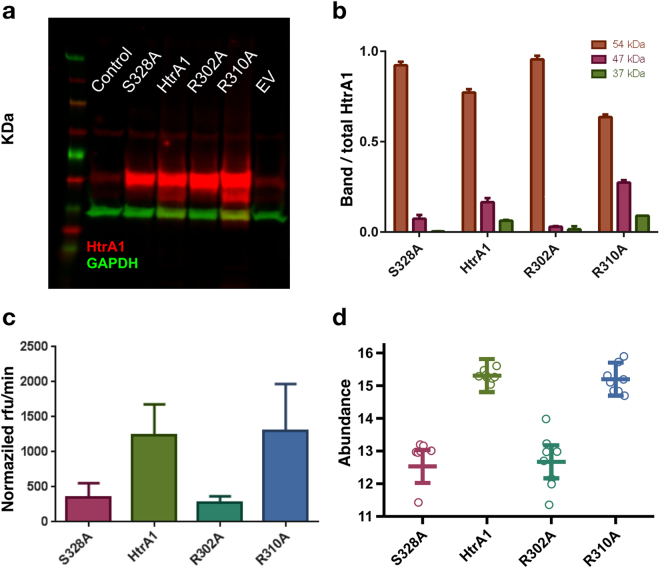
Figure 4.
(a) Western Blot (WB) of control sample (no virus), and vectors containing: HtrA1 mutant S328A (catalytic inactive control), HtrA1 wild-type, HtrA1 R302A mutant, HtrA1 R310A single mutant and empty vector. The yellow arrow indicates the 47 kDa band corresponding to the HtrA1 self-cleavage product. This image was cropped from an original blot displayed in Supporting Information. (b) WB quantification normalized first to GAPDH (Glyceraldehyde-3-phosphate dehydrogenase) and then to the total HtrA1 amount. Bands at 37, 47 and 54 kDa correspond to GAPDH, HtrA1 self-cleavage product and HtrA1 monomer respectively. (c) HtrA1 in vitro enzymatic assay measured in supernatant from WB, and normalized by total HtrA1 amount (Supp. Figure S5). (d) Extracellular HtrA1 activity monitored by the quantification of the semi-tryptic peptide NEQFNWVSR, which is generated through cleavage of clusterin at EQL362-NEQ.

