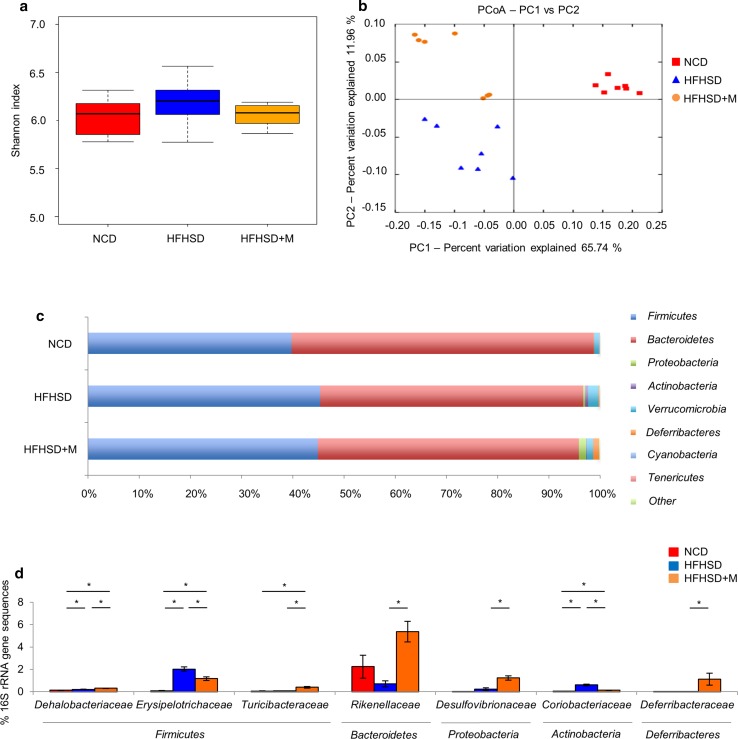
Fig. 4.
Gut microbiota changes in response to miglitol treatments. Mice were divided into three groups and fed a normal chow diet (NCD), a high-fat high-sucrose diet (HFHSD), or HFHSD containing 0.04% miglitol (HFHSD+M) for 12 weeks and then killed. a Estimates of bacterial diversity as assessed by the Shannon index (n = 7 per group). b Principal coordinates analysis (PCoA) plots based on the weighted Unifrac distance matrices showing the clustering of global microbiota (n = 7 per group). c Relative abundance of phyla in fecal samples between groups of mice (n = 7 per group). d Relative abundance of families in fecal samples between groups of mice (n = 7 per group). Data are presented as the mean ± standard error of the mean. PC principal coordinate, rRNA ribosomal RNA, asterisk statistical significance (p < 0.05)

