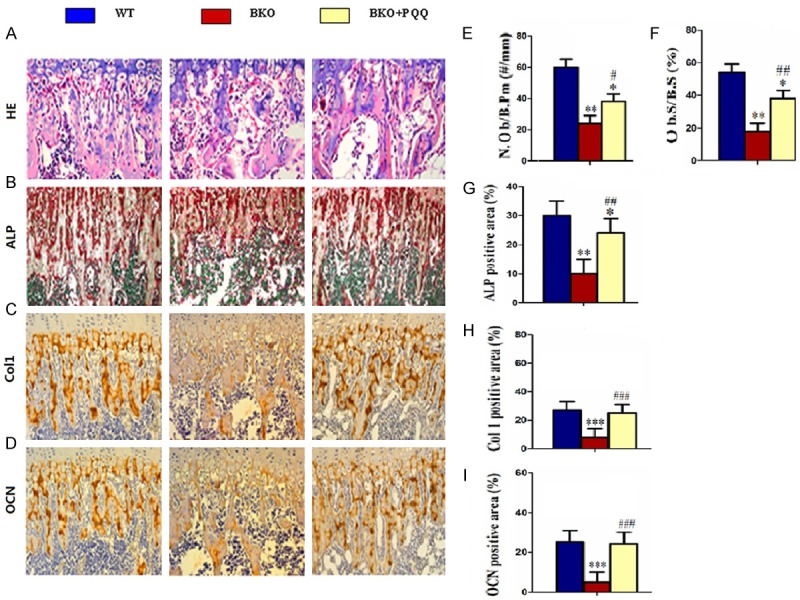
Figure 4.

Effect of PQQ on osteoblast formation of tibiae in Bmi1-/- mice. A. Micrographs of H&E staining of tibiae (400x). B. Micrographs of ALP staining of the tibiae (400x). C. Micrographs of Col I immunohistochemical staining of tibiae (400x). D. Micrographs of OCN immunohistochemical staining of tibiae (400x). E. Number of positive osteoblasts of tibiae. F. Percentage of positive areas osteoblast of tibiae. G. ALP positive areas of tibiae. H. Col I positive areas percentage of tibiae. I. OCN positive areas percentage of tibiae. Each value is the mean ± SEM of determinations in six animals of the same groups. *, P<0.05; **, P<0.01; ***, P<0.001, compared with WT mice; #, P<0.05; ##, P<0.01; ###, P<0.001, compared with BKO mice. Number of positive osteoblasts (N.Ob/B.Pm, #/mm) . Percent ratio of positive areas osteoblasts (Ob.S/B.S, %).
