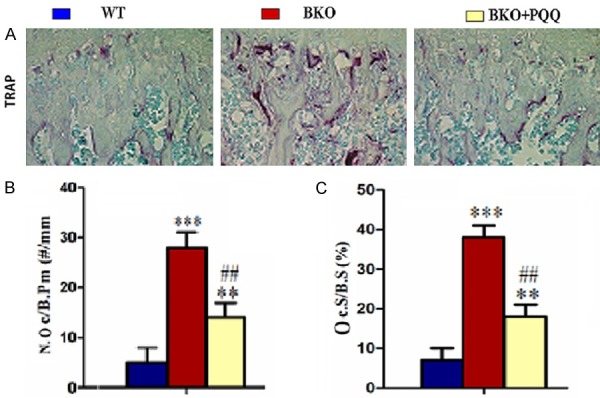
Figure 5.

Effect of PQQ on osteoclasts bone resorption of tibiae in Bmi1-/- mice. A. Micrographs of TRAP staining of tibiae (400x). B. Number of TRAP-positive osteoclasts of tibiae. C. Surface of TRAP-positive osteoclasts of tibiae; Each value is the mean ± SEM of determinations in six animals of the same groups. *, P<0.05; **, P<0.01; ***, P<0.001, compared with WT mice; #, P<0.05; ##, P<0.01; ###, P<0.001, compared with BKO mice. Number of TRAP-positive osteoclasts (N.Oc/B.Pm, #/mm). Surface of TRAP-positive osteoclasts (Oc.S/B.S, %).
