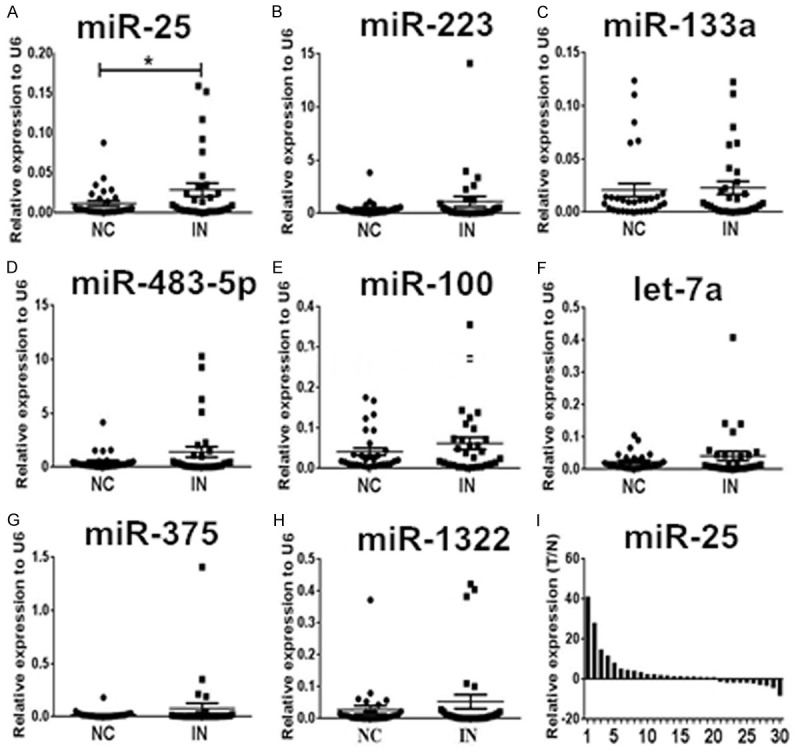
Figure 2.

Expression levels of the eight miRNAs examined in esophageal squamous cell intraepithelial neoplasia (IN) plaque tissues (n = 30) and the matched adjacent normal control (NC). A-H. Only miR-25 was up regulated with a significant difference. The relative expression levels of miRNAs were normalized to U6 snRNA. I. Expression levels of miR-25 were ranged from the largest to the smallest. Relative expression was calculated using the 2-Δcq method, and N refers to the normal control. *P < 0.05.
