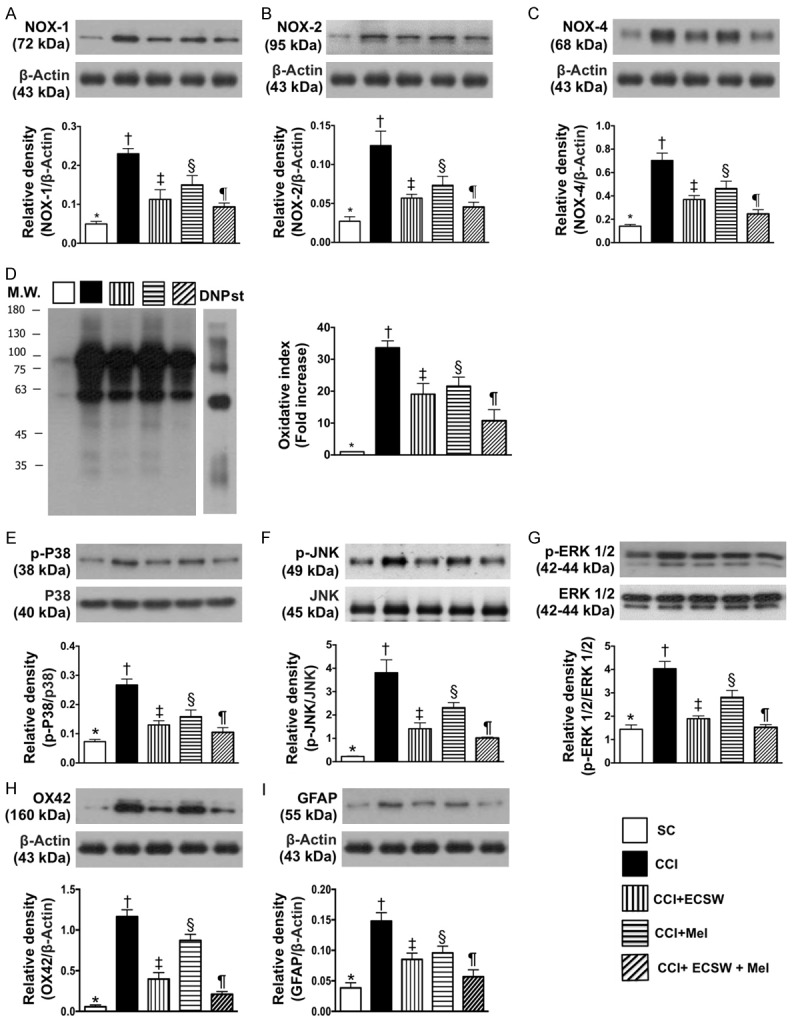
Figure 5.

Protein expressions of oxidative stress biomarkers and signaling transduction molecules, microglia and astrocyte activity in spinal dorsal horn (SDH) by day 8 after CCI procedure. A. Protein expression of NOX-1, * denotes statistical significance vs. other groups with different symbols (†, ‡, §, ¶), p<0.0001. B. Protein expression of NOX-2, * denotes statistical significance vs. other groups with different symbols (†, ‡, §, ¶), p<0.0001. C. Protein expression of NOX-4, * denotes statistical significance vs. other groups with different symbols (†, ‡, §, ¶), p<0.0001. D. Oxidized protein expression, * denotes statistical significance vs. other groups with different symbols (†, ‡, §, ¶), p<0.0001. (Note: left and right lanes shown on the upper panel represent protein molecular weight marker and control oxidized molecular protein standard, respectively). M.W = molecular weight; DNP = 1-3 dinitrophenylhydrazone. E. Protein expression of phosphorylated (p)-p38, * denotes statistical significance vs. other groups with different symbols (†, ‡, §, ¶), p<0.0001. F. Protein expression of p-JNK, * denotes statistical significance vs. other groups with different symbols (†, ‡, §, ¶), p<0.0001. G. Protein expression of p-ERK1/2, * denotes statistical significance vs. other groups with different symbols (†, ‡, §, ¶), p<0.0001. H. Protein expression of ox42, * denotes statistical significance vs. other groups with different symbols (†, ‡, §, ¶), p<0.0001. I. Protein expression of grialfibrillary acidic protein (GFAP), * denotes statistical significance vs. other groups with different symbols (†, ‡, §, ¶), p<0.0001. All statistical analyses were performed by one-way ANOVA, followed by Bonferroni multiple comparison post hoc test (n = 8 for each group). Symbols (*, †, ‡, §, ¶) indicate significance at the 0.05 level. SC = sham control; CCI = chronic constriction injury; ECSW = extracorporeal shock wave; Mel = melatonin.
