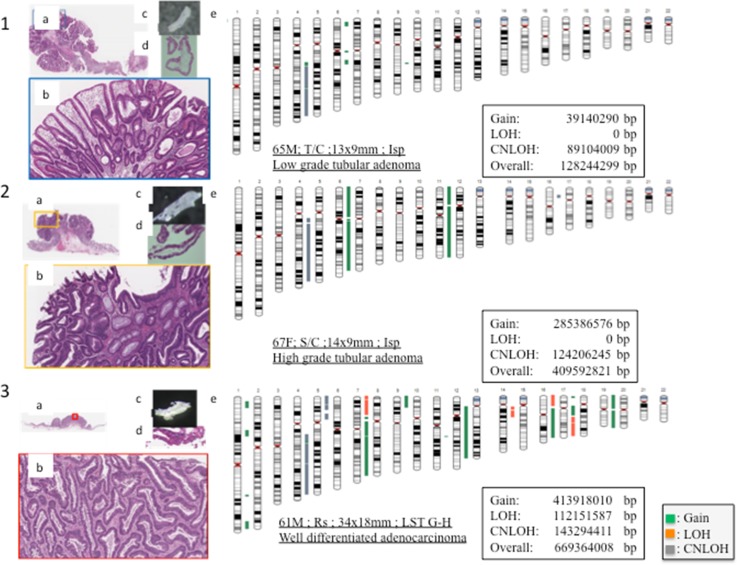
Fig. 3.
1: Representative images of low-grade adenoma (a loupe image of low-grade adenoma, b low-power view of the lesion showing low-grade adenoma, c an isolated tumour gland under a dissection microscope, d high-power histological view of the isolated gland) and an ideogram showing copy number variations (e). 2: Representative images of high-grade adenoma (a loupe image of high-grade adenoma, b low-power view of the lesion revealing high-grade adenoma, c an isolated tumour gland under a dissection microscope, d high-power histological view of the isolated gland) and an ideogram showing copy number variations (e). 3: Representative images of intramucosal adenocarcinoma (a loupe image of intramucosal adenocarcinoma, b low-power view of the lesion showing intramucosal adenocarcinoma, c an isolated tumour gland under a dissection microscope, d high-power histological view of the isolated gland) and an ideogram showing copy number variations (e). In the ideograms, green represents gain, red represents loss of heterozygosity (LOH) and grey represents copy-neutral loss of heterozygosity (CNLOH). LST laterally spreading tumour

