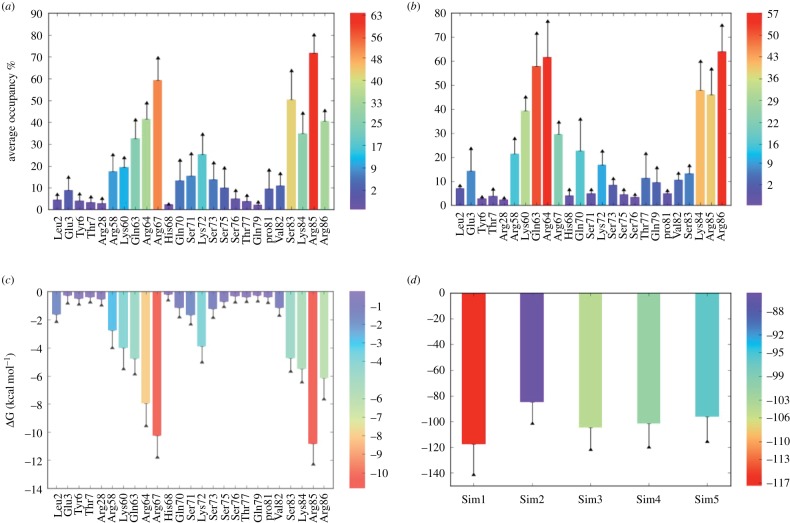
Figure 5.
CXCL13–dp4 binding studies from MD simulations. (a) Average inter-molecular hydrogen-bond occupancy for dp4 binding residues in clusters 1 and 5, from all five performed simulations. (b) Average occupancy of water-mediated interaction between CXCL13 and dp4 residues in the interacting regions of clusters 1 and 5 from all the five simulations. (c) Single-residue energy decomposition values for CXCL13–dp4 interaction from clusters 1 and 5 regions. (d) Total binding free energy values with standard deviation as error for the CXCL13–dp4 complex from all the five simulations. For better understanding, the values from lower to higher are represented by rainbow colour bars from blue to red, respectively. The error bar shows the standard error of the mean.

