Figure 1.
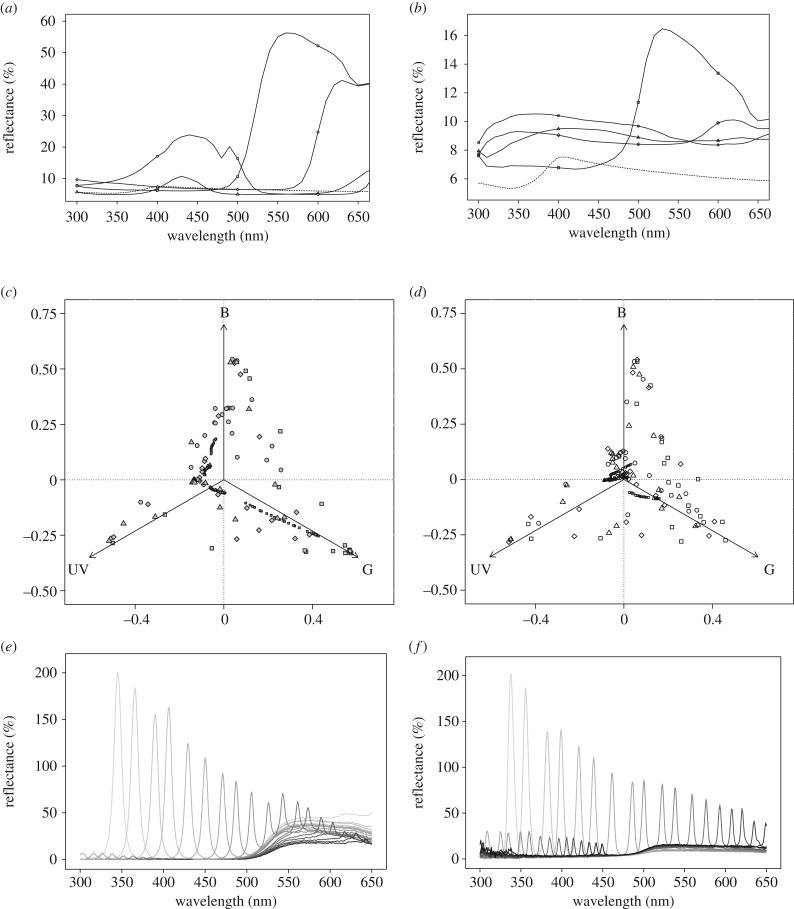
(a,b) Reflectance spectra obtained in spectrometry with an integrating sphere. Field background (dashed line) and flower targets of (a) low (high pigment concentration) and (b) high (low pigment concentration) level of iridescence. (c,d) Chromatic location of colours in the triangle colour space for targets with (c) low (high pigment concentration) and (d) high (low pigment concentration) level of iridescence detectability (shown in colour in figure S6a,b). The triangle is not entirely presented for clarity reasons. Spectra were measured in goniospectrometry every 2°, between θ = 26° and θ = 70°, between 300 and 650 nm (details in electronic supplementary material). (e,f) Examples of spectra acquired in goniospectrometry for yellow targets of (e) low (high pigment concentration) and (f) high (low pigment concentration) level of iridescence. The peak of the diffraction ray is shifted towards longer wavelengths (darker lines) as the angle of light collection departs from the normal to target surface, as expected in a linear diffraction grating. For the sake of clarity, the intensity of diffracted rays was set to a maximum of 200%. Target colours were violet (triangle), blue (circle), yellow (square) and red (diamond) for high (empty symbols) or low (grey symbols) detectability of iridescence, and for iridescent (large symbols) and non-iridescent (small symbols) targets. Note that diffraction intensity decreases with an increasing collection angle, a fact that is characteristic of blazed gratings (explanation in electronic supplementary material).

