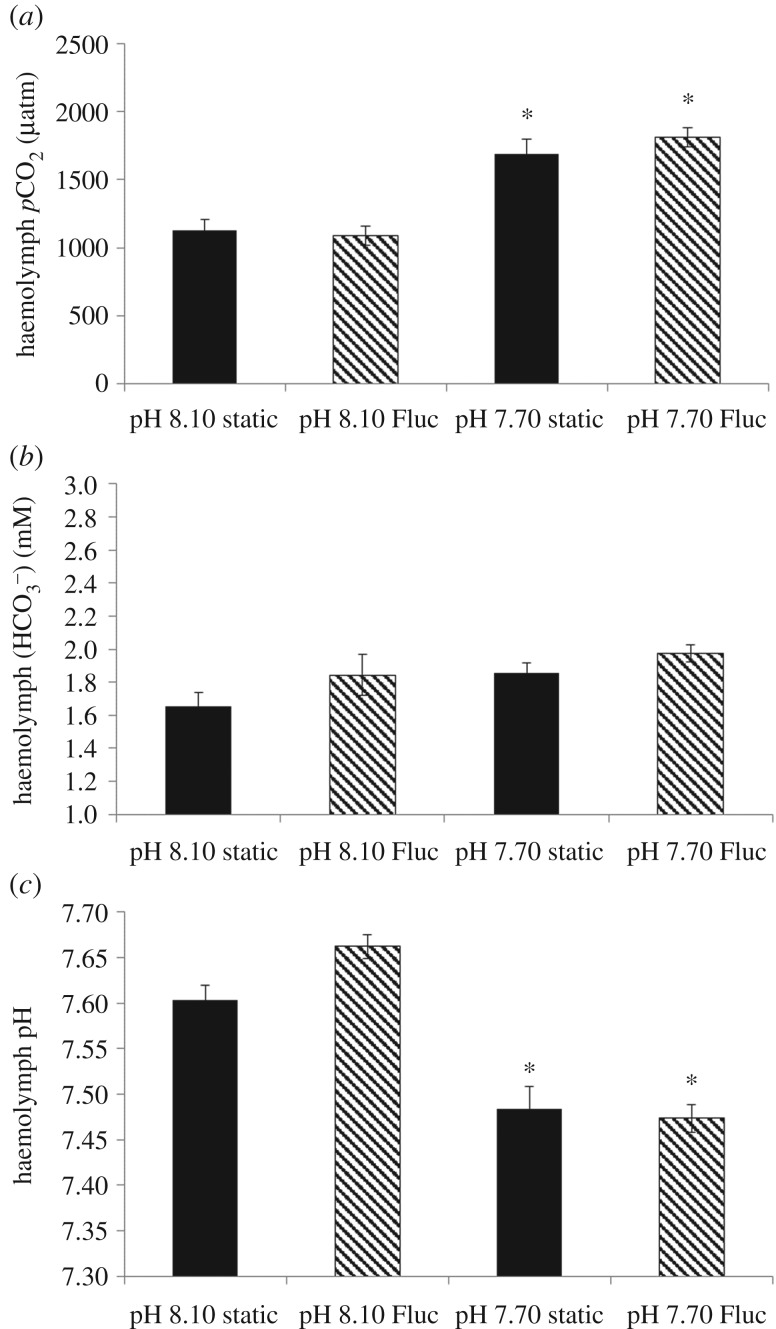
Figure 2.
Acid–base parameters in the haemolymph of M. edulis following a 14-day exposure to control and lowered pH in static and fluctuating (Fluc) pH regimes: (a) haemolymph pCO2; (b) haemolymph bicarbonate concentration ( ); and (c) haemolymph pH. Data shown as mean ± s.e. Asterisk represents significant differences from the static pH 8.10 treatment.

