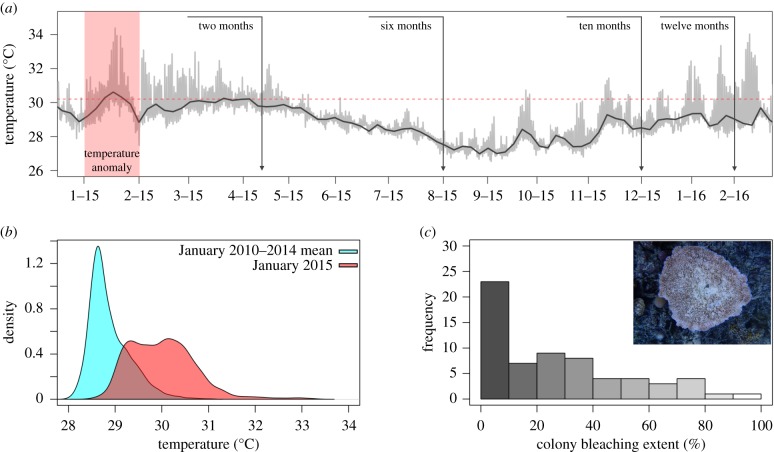
Figure 1.
The 2015 bleaching event on Ofu, American Samoa. (a) Time-series temperature data taken from back-reef pool 400 [25] in the National Park of American Samoa. Red panel highlights the warm water event that struck the region in January 2015. Vertical lines indicate approximate sample dates and the horizontal red line represents the NOAA regional bleaching threshold. (b) Density plot comparing temperature data in January 2015 with the previous 3 years. (c) Histogram of bleaching scores for all A. hyacinthus colonies (n = 64) surveyed during bleaching in April 2015. (Online version in colour.)

