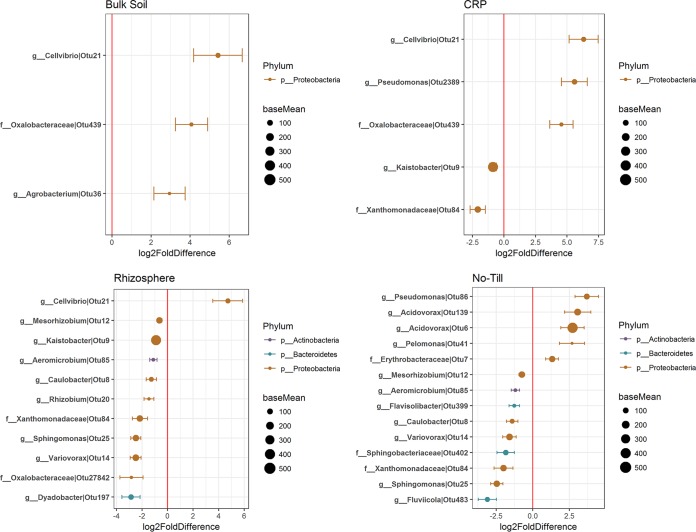
FIG 3.
Distribution of log2 fold changes in DAotus in 2015. Diagrams show the normalized sequence count (base mean) of DAotus in each soil type that were increased or decreased by glyphosate treatment, colored by the bacterial phyla to which they belong. Only DAotus with base means of >30 are presented. The red vertical line represents a zero-fold change, where OTUs to the right of the line (positive values) are increased in relative abundance with glyphosate, and those to the left of the line (negative values) are reduced in relative abundance with glyphosate. g, genus; f, family; p, phylum.

