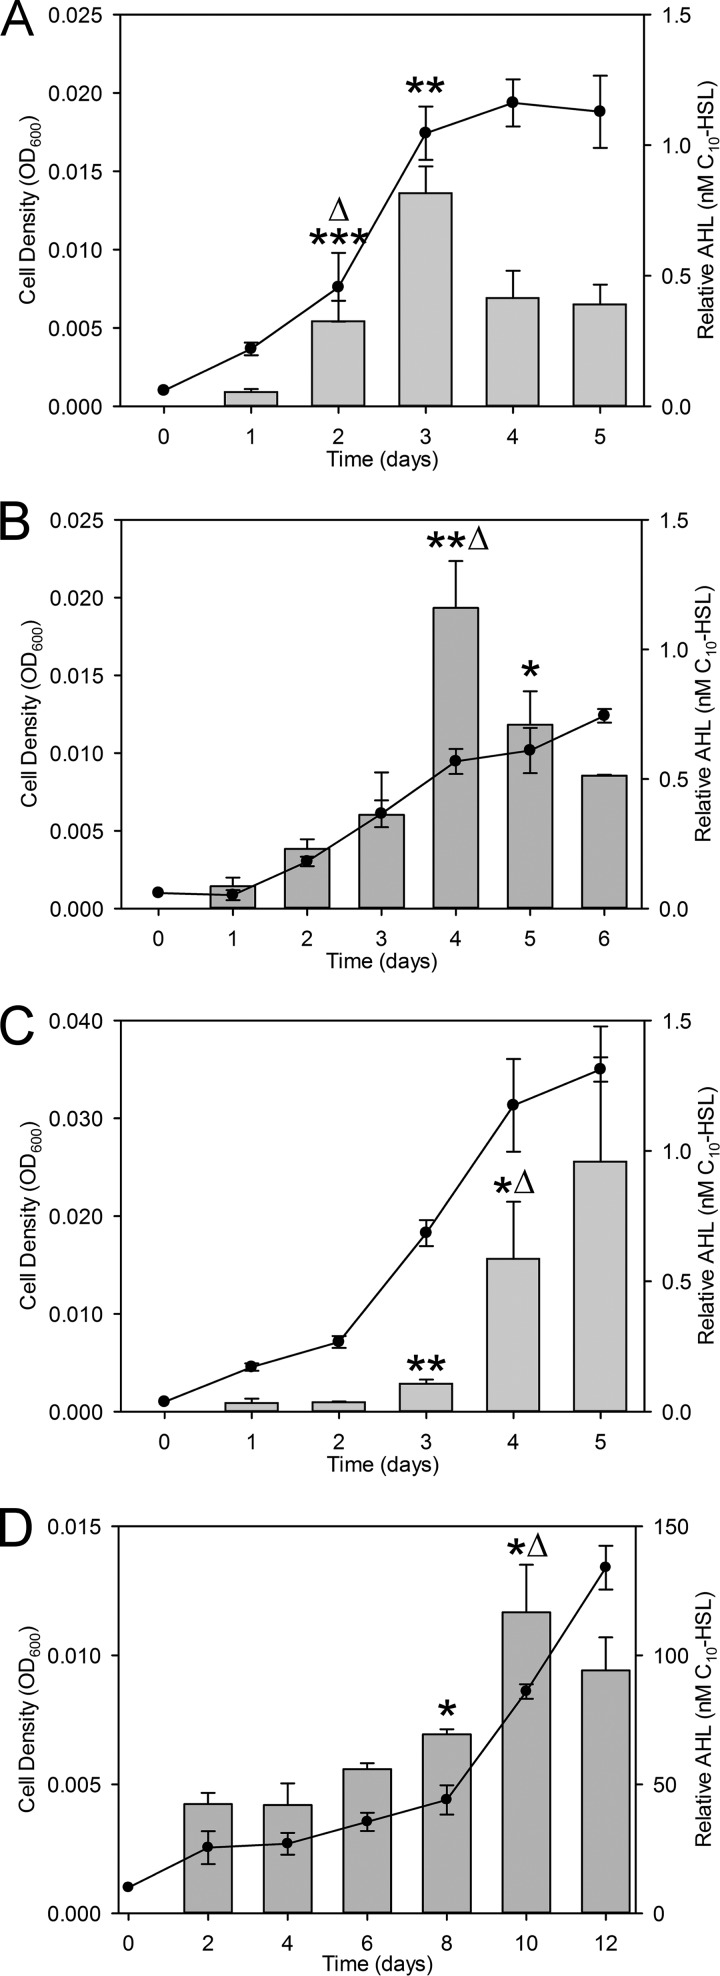
FIG 2.
AHL production during growth in batch culture. AHLs were detected by a bioassay during batch culture of the NH3 oxidizers Nss. multiformis (A) and Nss. briensis (B) and the NO2− oxidizers Nb. vulgaris (C) and Ns. moscoviensis (D). Circles indicate the cell density (OD600) (left y axis), and bars represent the relative AHL concentration detected (equivalent to nanomolar concentrations of C10-HSL) (right y axis) over time (days) (x axis). Relative AHL concentrations were quantified based on C10-HSL standards reported previously, but actual concentrations vary depending on the AHL being measured (22, 36). Asterisks indicate statistically significant changes in AHL concentrations compared to previous measurements (*, P ≤ 0.05; **, P ≤ 0.005; ***, P ≤ 5e−4 [versus all previous measurements, as determined by a two-tailed t test]). Delta indicates a statistically significant increase in the amount of AHLs produced per OD600 compared to the amount measured the previous day (Δ, P ≤ 0.05). Values are the means of data from three independent biological replicates. Error bars indicate the standard deviations of the means.

