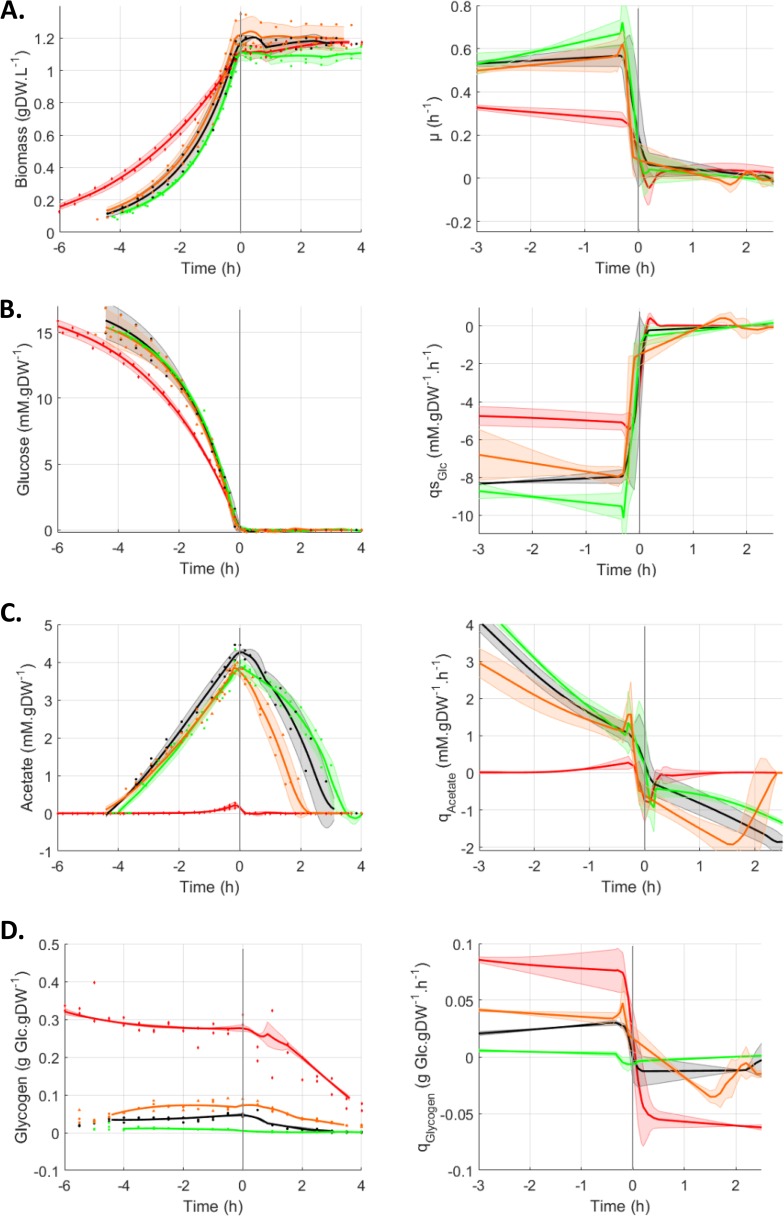
FIG 1 .
Behavior of Csr system mutants during the glucose-acetate transition. Cultures were monitored from 6 h before to 4 h after glucose exhaustion, which was set as time zero. All data concerning the replicates are displayed as dots, and the fitted average value of each strain is displayed as a line. Shaded areas represent ±1 standard deviation. WT, black circles; csrBC mutant, green squares; csrD mutant, orange triangles; csrA51 mutant, red diamonds. (A) Changes in the biomass concentration (gDW ⋅ liter−1) and growth rate μ (h−1). (B) Extracellular glucose concentration (mM) and specific glucose production rates (mM ⋅ h−1 ⋅ gDW−1 ⋅ h−1). (C) Extracellular acetate concentration (mM) and specific acetate production rates (mM ⋅ h−1 ⋅ gDW−1 ⋅ h−1). (D) Glycogen concentration (ggluc ⋅ gDW−1) and specific glycogen production rates (ggluc ⋅ h−1 ⋅ gDW−1 ⋅ h−1).

