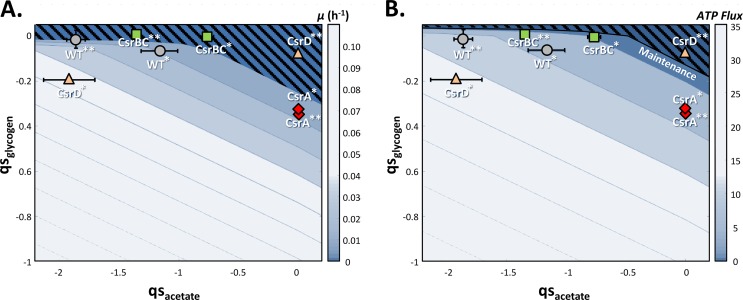
FIG 4 .
Metabolic capacities of the WT and Csr system mutant strains during growth on glycogen and acetate. Flux balance analysis of the four strains was performed with glycogen and acetate as carbon sources by using two different objective functions, biomass and ATP production (see Materials and Methods for details). (A) Maximum predicted growth rates (μ) for various pairs of glycogen and acetate uptake rates (qs). (B) Maximum flux of ATP predicted by the model. Bars to the right of each plot indicate the color code used for the growth rate (A) and ATP flux (B) values. The four strains, the WT (gray circles), the csrBC mutant (green squares), the csrD mutant (orange triangles), and the csrA51 mutant (red diamonds), were assessed at two different times 90 min (*) and 150 min (**). The values are averages of three replicates with error bars representing standard deviations.

