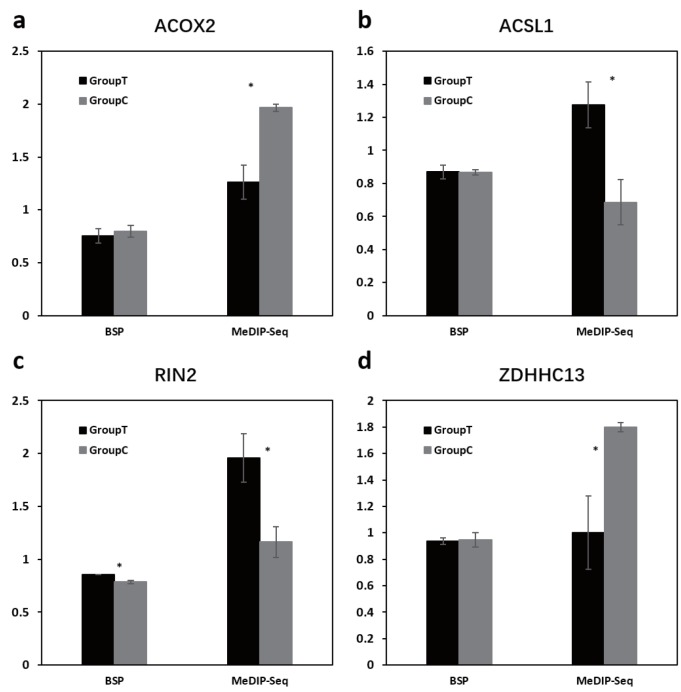
Figure 7.
Bisulphite sequencing PCR (BSP) validation for differential methylated regions (DMRs). For the BSP, the y axes were the mean methylation percentage of three sequencing samples for each group in the DMR. For the methylated DNA immunoprecipitation-sequencing (MeDIP-seq), the y axes indicated mean normalized methylation level in the DMR. The group C and group T is the Small Tailed Han and Dorper×Small Tailed Han crossbred sheep. The star (*) indicated the significant difference (p<0.05, t-test). Subfigures a–d were the DMRs in gene ACOX2 intron region (chr19:42869604–42870470), ACSL1 CDS region (chr26:13938540–13939276), RIN2 upstream region (chr13:38607690–38608423), and ZDHHC13 upstream region (chr21:25146996–25148088), respectively.

