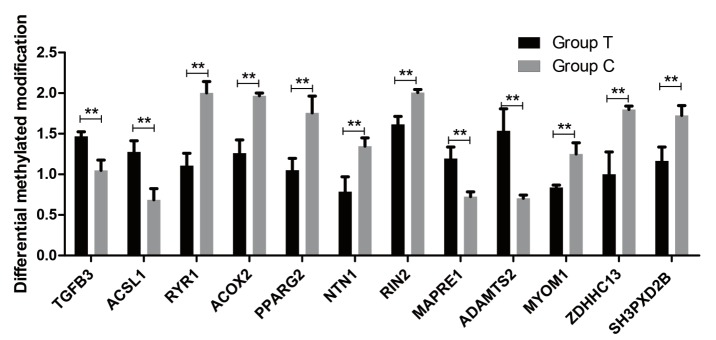
Figure 9.
Differential methylated modification of genes. There were significant differences in the methylation levels of each gene between two groups. Data represent means±standard error of the mean (n = 3). ** p≤0.01. The Group C and Group T is the Small Tailed Han and Dorper×Small Tailed Han crossbred sheep, respectively.

