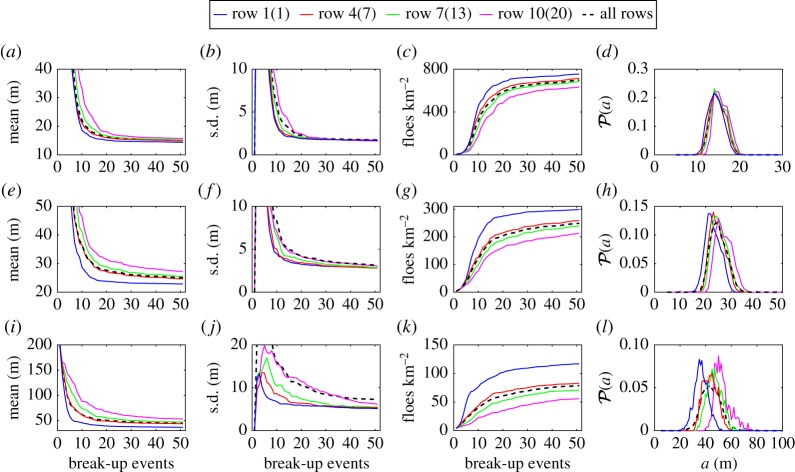
Figure 10.
Evolution of (a,e,i) the mean, (b,f,j) the standard deviation and (c,g,k) the number of floes per square kilometre of the FSD, and (d,h,l) PDFs of the FSD after 50 break-up events. Results are shown for the floe thicknesses (a–d) D=1 m, (e–h) D=2 m and (i–l) D=4 m, and rows 1(1), 4(7), 7(13) and 10(20) in the arrays of floes with D=1 m (2 and 4 m) as solid blue, red, green and magenta lines, respectively. We also include results for the entire array (black dashed line) for comparison.

