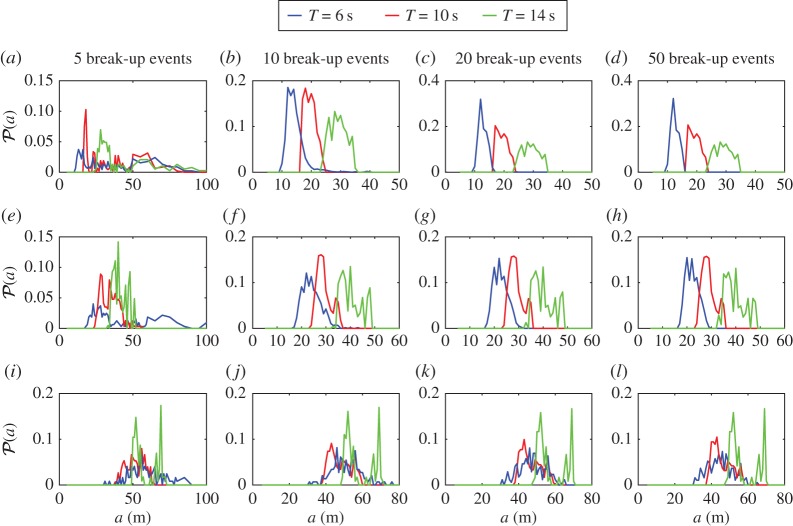
Figure 4.
Evolution of the floe size PDF during the repeated break-up of a single floe with radius amax=200 m. Results are displayed for (a–d) D=1 m, (e–h) D=2 m and (i–l) D=4 m and wave periods T=6, 10 and 14 s (blue, red and green lines, respectively). The PDFs are shown after (a,e,i) s=5, (b,f,j) 10, (c,g,k) 20 and (d,h,l) 50 break-up events.

