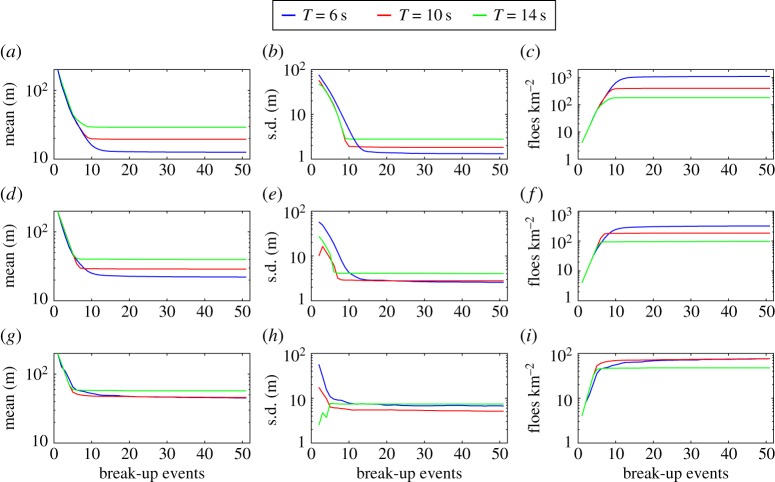
Figure 5.
Evolution of (a,d,g) the mean and (b,e,h) standard deviation (s.d.) of the FSD, and (c,f,i) the number of floes per square kilometre, through the 50 break-up events. Each row of panels and line colour corresponds to a floe thickness and wave period, respectively, as defined in figure 4.

