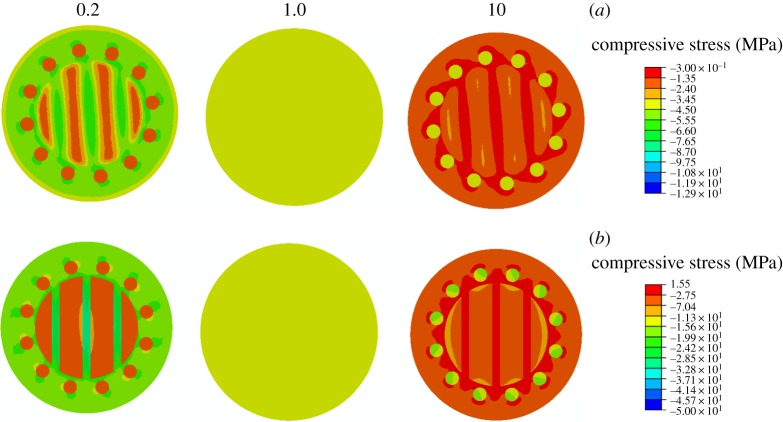
Figure 8.
Compressive stress distributions in helicoidal structures at different fibre–matrix modulus ratios of 0.2, 1 and 10. Scale bar (a) for contours at ratios of 0.2 and 1 and scale bar (b) for contours at a modulus ratio of 10. The top planes are contours of interlayer matrices, while the bottom planes are contours of rotated fibres. (Online version in colour.)

