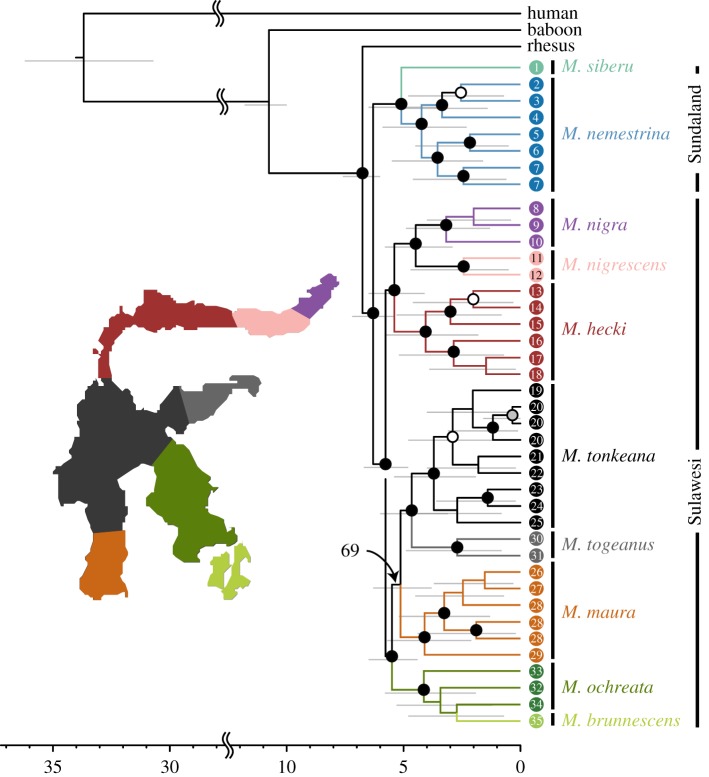
Figure 2.
Time-calibrated phylogeny (chronogram) recovered from analysis of autosomal RADseq data. Scale indicates divergence in million years ago (Ma). Black, grey, and white dots over nodes reflect ultrafast bootstrap values from iqtree that are greater than 99, 95 and 90, respectively. Grey bars near each node indicate the 95% CI for divergence times recovered from mcmctree. An inset indicates ranges of Sulawesi macaques and low bootstrap support for one node is indicated with an arrow. Tips are numbered according to their geographical localities depicted in figure 1.

