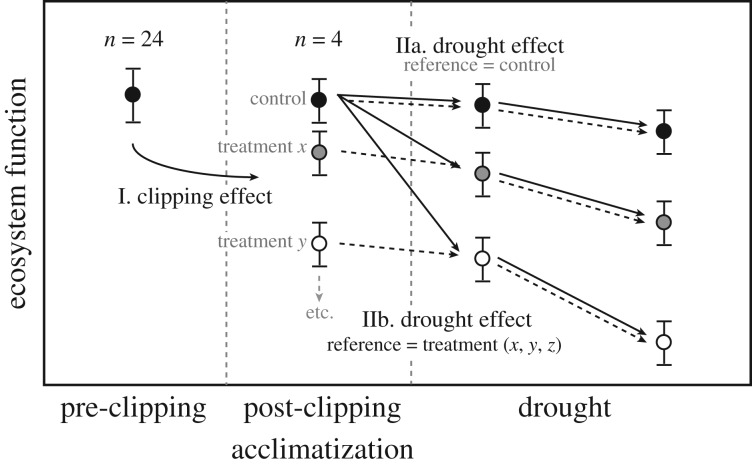
Figure 1.
Schematic set-up of the data analyses. The effect of clipping on each ecosystem function (I. clipping effect) was calculated as the difference in ecosystem function before clipping (mean of all values, n = 24) and after clipping. z-values were calculated after standardization by the pre-clipping mean and standard deviation. The effect of drought was calculated in two different ways. First (IIa), the effect of drought for each plant removal treatment on each ecosystem function was calculated as the difference in the respective function during drought and the post-clipping acclimatization control values. Hence, for each treatment z-values were calculated after standardization by the post-clipping acclimatization control. In the second approach (IIb), instead of using the post-clipping acclimatization control as a reference, the post-clipping acclimatization ecosystem function values for each corresponding treatment were used.

