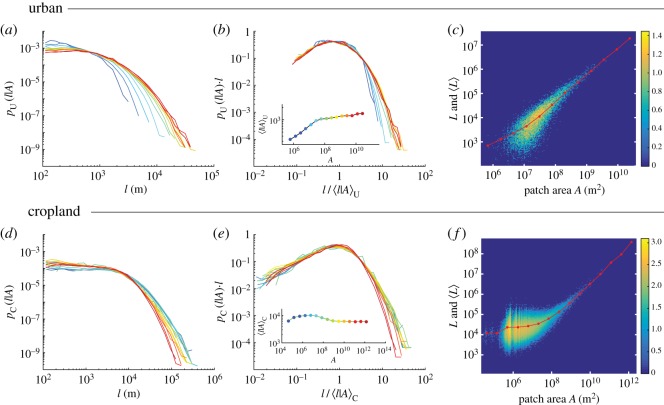
Figure 2.
Length distributions for urban (a–c) and cropland (d–f) roads conditional on patch areas. Road length distributions conditional on various values of urban (a) and cropland (d) patch area A, divided into logarithmic bins (colour-coded as indicated in the insets of b,e). (b,e) Road length distributions rescaled according to equations (2.2) and (2.3), respectively. The insets show the mean road lengths 〈l | A〉U (b) and 〈l | A〉C (e) as functions of A. Distributions on double-logarithmic scales of total road length L in urban (c) and cropland (f) patches of different areas, considering all urban and cropland patches on the Earth. Red lines and dots indicate the mean total road length as a function of patch areas. Colourmaps display logarithmic counts of patches in base 10.

