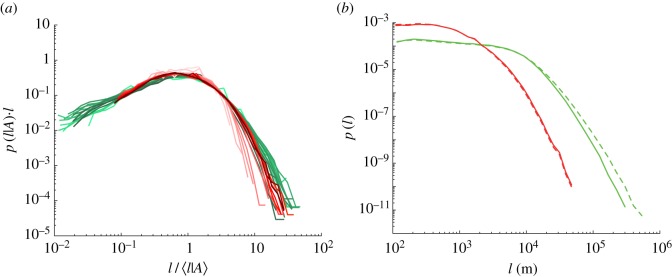
Figure 3.
(a) Superimposed rescaled urban (red curves) and cropland (green curves) data from figures 2b,e, demonstrating that the scaling functions GU and GC coincide, further confirming the universality of road length distributions in different land-use classes. (b) According to our approximation (see Material and methods), the ensemble distribution of urban road lengths (dashed red curve here and in figure 1c) coincides with the distribution of urban road lengths belonging to urban patches larger than A>108 m2 (red solid curve). The same approximation also holds for the distribution of cropland road lengths, but the tail of the ensemble distribution of cropland road lengths (green dashed line) is ‘fatter’ than the distribution of cropland road lengths associated with cropland areas larger than A>109 m2 (solid green line), leading to a slight deviation in the collapse of the tails of the ensemble distributions visible in figure 1d.

