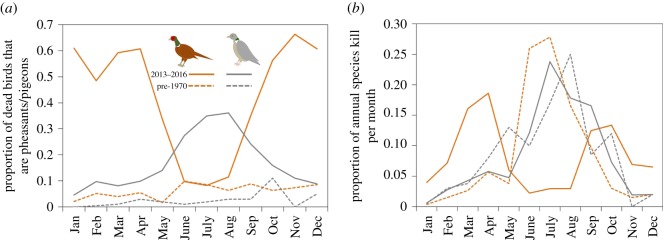
Figure 1.
Pheasants (orange lines) and pigeons (grey lines) killed as (a) a proportion of total birds reported killed by vehicle collisions and (b) a proportion of each category killed per year in each month, for pheasants between 2013 and 2016 (solid orange line) and before 1970 (dashed orange line) and for pigeons between 2013 and 2016 (solid grey line) and before 1970 (dashed grey line).

