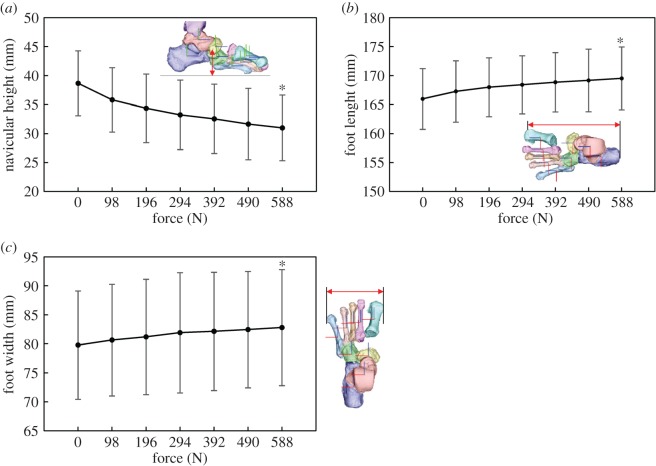
Figure 5.
Changes in the foot dimensions during axial loading. (a) Navicular height, (b) foot length, (c) foot width. Means and standard deviations across five specimens were illustrated by markers and error bars, respectively. The asterisk indicates that the mean changes of the foot dimensions at 588 N are significantly different from zero (p < 0.05).

