FIGURE 10.

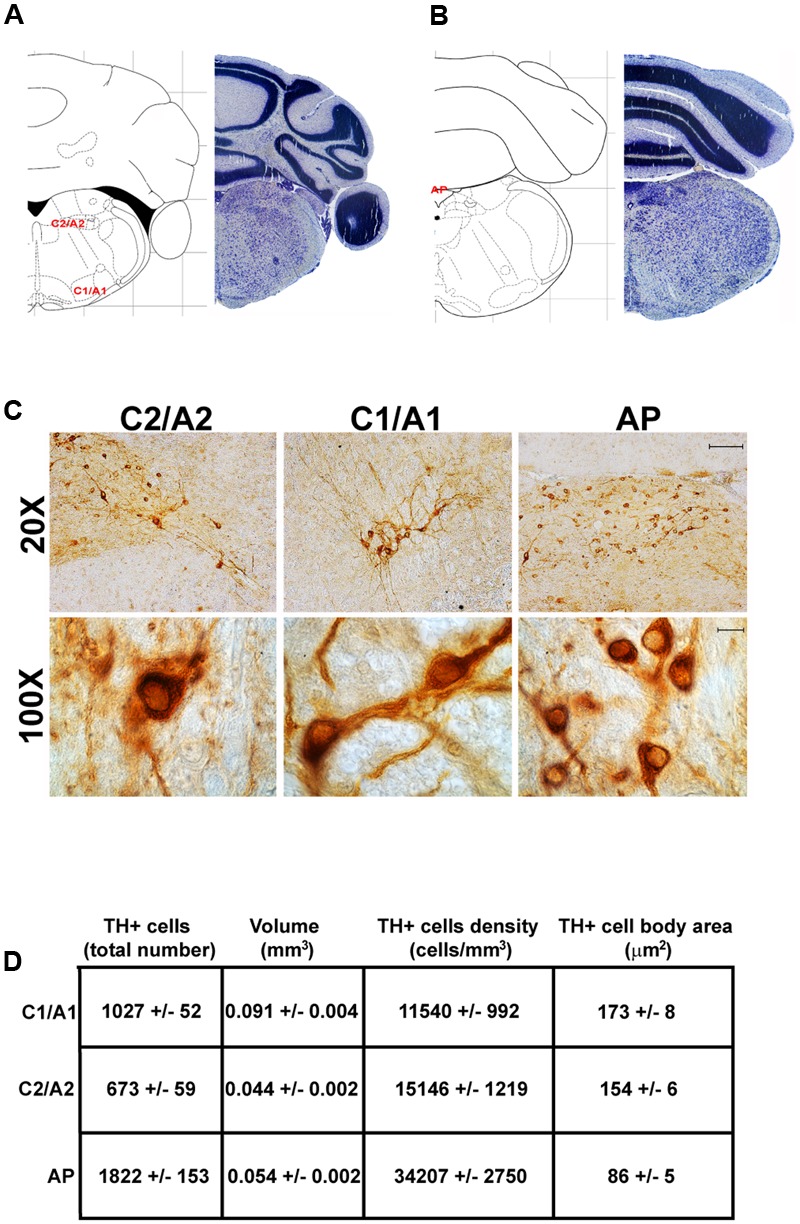
Anatomical and morphometric analyses of TH-positive cell of the C1/A1, C2/A2, and AP catecholaminergic nuclei. Nissl staining of the mouse brain at the Bregma level –6.36 (A) and –7.32 (B) (Paxinos and Franklin, 2001) showing the anatomical localization of C1/A1, C2/A2, and AP catecholaminergic groups. (C) Representative images of TH immunoreactive cells of the C1/A1, C2/A2, and AP. Images at higher magnification (100X) show the morphological features of these TH positive cells. Scale bar: 100 μm for 20X and 10 μm for 100X. The corresponding morphometric analyses are shown in (D). Values are means ± SEM.
