
FIGURE 11.
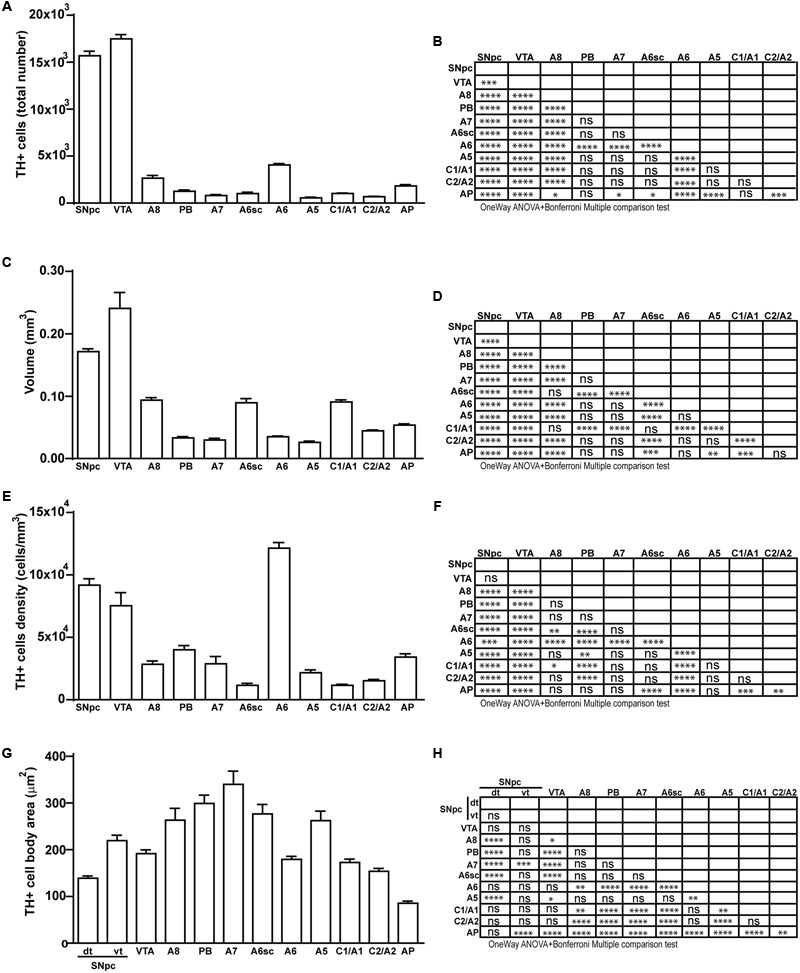
Total number, volume, density, and cell body area of TH positive nuclei. (A) Stereological analysis of TH-positive cells. (B) Statistical analysis (one-way ANOVA plus Bonferroni); ∗p < 0.05; ∗∗p < 0.01; ∗∗∗p < 0.001; ∗∗∗∗p < 0.0001. (C) Volumetric quantification of each cathecholaminergic nucleus obtained with the Cavalieri’s method. (D) Statistical analysis (one-way ANOVA plus Bonferroni); ∗p < 0.05; ∗∗p < 0.01; ∗∗∗p < 0.001; ∗∗∗∗p < 0.0001. (E) TH-positive cell density (cells/mm3). (F) Statistical analysis (one-way ANOVA plus Bonferroni); ∗p < 0.05; ∗∗p < 0.01; ∗∗∗p < 0.001; ∗∗∗∗p < 0.0001. (G) TH-positive cell body area (μm2). (H) Statistical analysis (one-way ANOVA plus Bonferroni); ∗p < 0.05; ∗∗p < 0.01; ∗∗∗p < 0.001; ∗∗∗∗p < 0.0001.