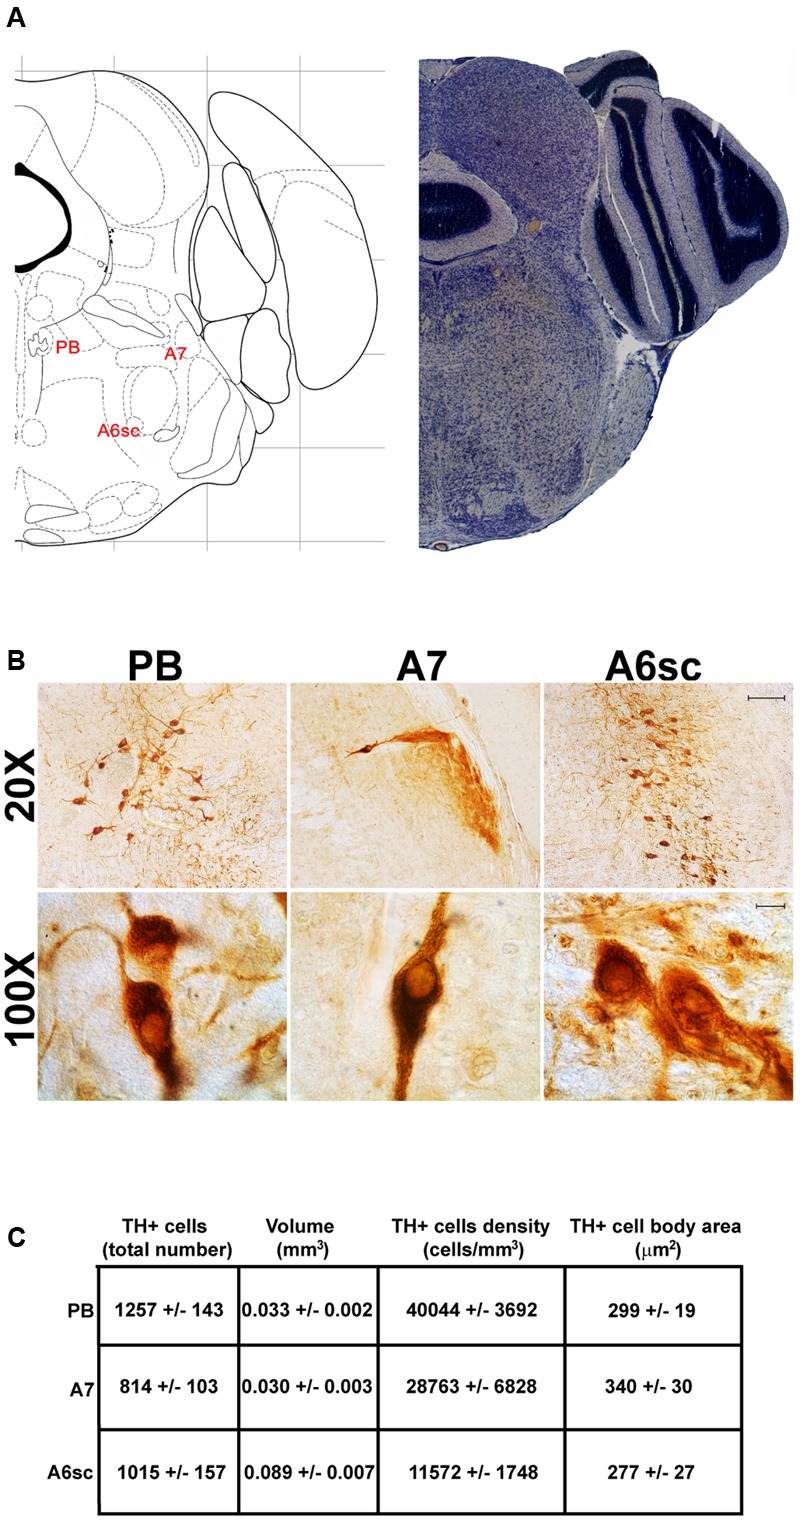
FIGURE 6.

Anatomical and morphometric analyses of TH-positive cell of the PB, A7, and A6sc catecholaminergic nuclei. (A) Nissl staining of the mouse brain at the Bregma level –5 (Paxinos and Franklin, 2001) showing the anathomical localization of the PB, A7 noradrenergic group and the A6sc. (B) Representative images of TH immunoreactive cells of the PB, A7, and A6sc. Images at higher magnification (100X) show the morphological features of these TH positive cells. Scale bar: 100 μm for 20X and 10 μm for 100X. The corresponding morphometric analyses are shown in (C). Values are means ± SEM.
