
FIGURE 2.
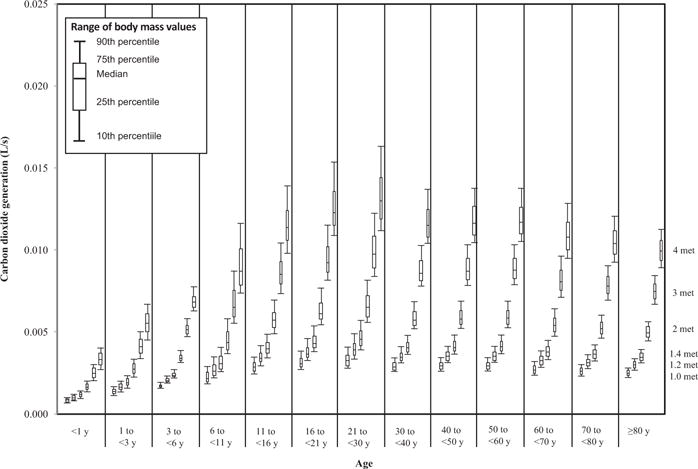
Variation in CO2 generation rate at 273 K and 101 kPa associated with variation in age, body mass, and level of physical activity for females
Official websites use .gov
A
.gov website belongs to an official
government organization in the United States.
Secure .gov websites use HTTPS
A lock (
) or https:// means you've safely
connected to the .gov website. Share sensitive
information only on official, secure websites.
Variation in CO2 generation rate at 273 K and 101 kPa associated with variation in age, body mass, and level of physical activity for females