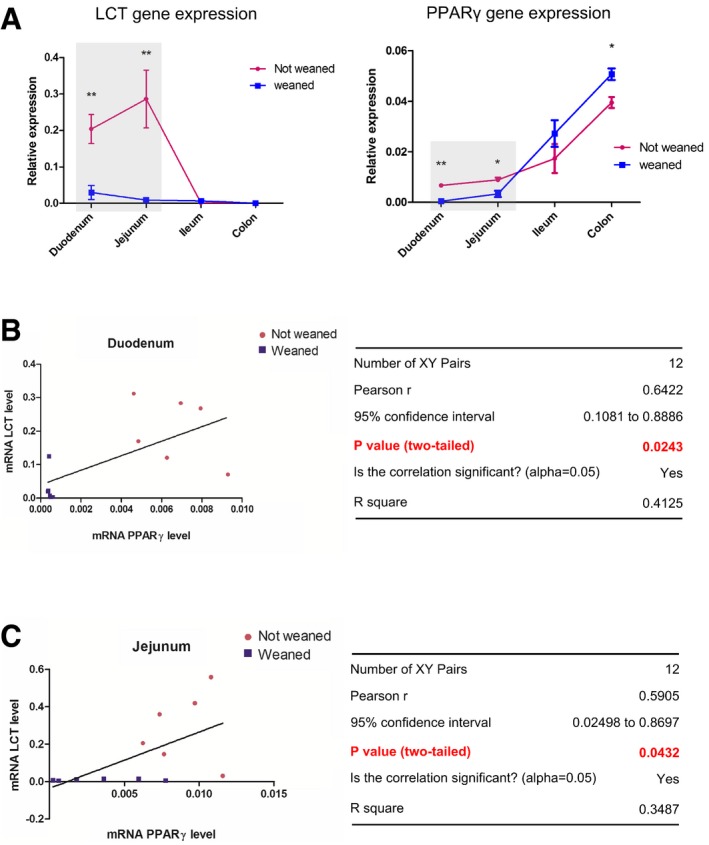
Figure EV4. LCT and PPARγ genes expression correlate in the rat duodenum and jejunum.

-
AComparison of the LCT and PPARγ mRNA levels along the gut of “not weaned” and “weaned” rats. Gene expression level was determined by qPCR of corresponding mRNA. Results represent the mean ± SD of the relative expression normalized to GAPDH level (for each group n = 6). *P < 0.05, **P < 0.01. Statistical analysis: two‐tailed nonparametric Mann–Whitney U‐test.
-
B, CCorrelation between the LCT mRNA and PPARγ mRNA levels in the duodenum and jejunum of rats (not weaned and weaned).
