
Figure EV5. LCT expression and activity in rats following CLA administration.
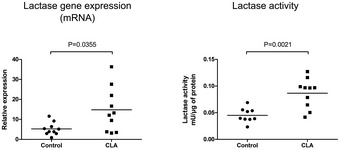
LCT gene expression (qPCR) and LCT activity were assessed in the proximal small intestine of weaned Sprague Dawley rats treated with oral CLA (200 mg/kg) for 5 days. Horizontal bars represent mean values (n = 10). Statistical analysis: two‐tailed nonparametric Mann–Whitney U‐test.