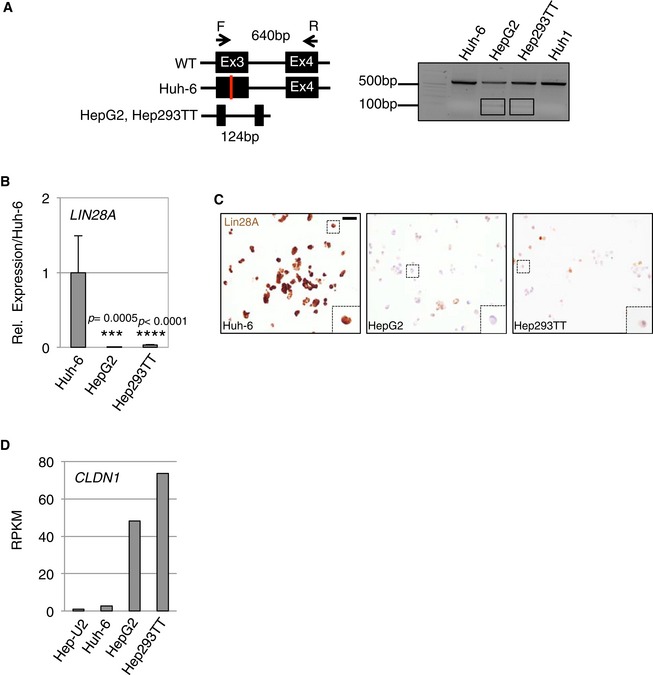
Figure EV1. Molecular characterization of embryonal and fetal‐like HB cells.

- Schematic representation of the primers used to amplify the genomic region spanning exon 3 to exon 4 of the CTNNB1 gene (left panel). Genomic DNA was isolated from the indicated cells lines and amplified by PCR. A PCR product of 640 bp was obtained from the full‐length CTNNB1 gene. The appearance of a 124‐bp band in HepG2 and Hep293TT indicated a heterozygous deletion of CTNNB1 gene (right panel).
- Real‐time PCR analysis for the expression of LIN28A in the indicated cell lines. Data show means ± s.d. (n = 3). P‐values were determined by Mann–Whitney test.
- Immunocytochemistry of Lin28A on the indicated cell lines. Dashed squares highlight a zoom on a cell. Scale bar: 20 μm.
- Expression analysis (RPKM) of the fetal marker claudin‐1 (CLDN1) in the HB cell lines.
