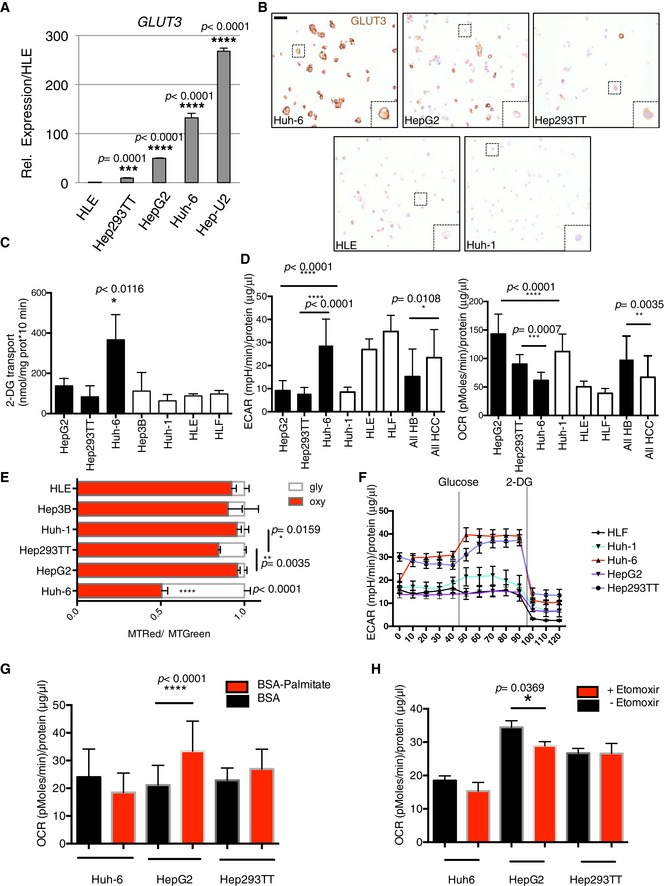
Expression of GLUT3 in the different cell lines. Data show means ± s.d. (n = 3). P‐values were determined by Mann–Whitney test.
Immunocytochemistry of GLUT3 on the indicated cell lines. Dashed squares highlight a zoom on a cell. Scale bar: 20 μm.
2‐Deoxy‐d‐[3H]glucose (DG) incorporation was measured in the indicated HB cell lines. Data show means ± s.d. (n = 5) of glucose uptake (nmol) normalized to protein concentration. Huh‐6 values were significantly different (*P < 0.05, Mann–Whitney test) to each other cell lines. The highest P‐value is indicated.
Seahorse analysis of lactate production (ECAR) and oxygen consumption (OCR) in HB cell lines. Analysis was done on 10 measurements per sample and was performed 3 times. Data show means ± s.d. P‐values were determined by Mann–Whitney test.
Flow cytometry analysis of the oxidative state (oxy) with MitoTracker Red (MTRed) and Green (MTGreen). Data are normalized to total mitochondrial mass (MTRed/MTGreen). Glycolytic state (gly) was calculated as 1 – (MTRed/MTGreen). Huh‐6 values were significantly different (****P < 0.0001) to each other cell lines. Data show means ± s.d. (n = 5). P‐values were determined by Mann–Whitney test.
After 24 h of glucose starvation, 10 mM glucose was added to the wells followed by 2‐DG to block glycolysis at a concentration of 50 mM. Sequential measurements of ECAR from 10 replicates after the injections were done. Data show means ± s.e.m.
After 24 h in limited medium, BSA‐palmitate or BSA was added just before seahorse experiment; 5 sequential measurements of OCR from 10 replicates were done. Data show means ± s.d. P‐values were determined by Mann–Whitney test.
After 24 h in limited medium, BSA‐palmitate or BSA was added just before seahorse experiment in presence or in absence of 10 mM Etomoxir. Five sequential measurements of OCR from 10 replicates were done. Data show means ± s.d. P‐values were determined by Mann–Whitney test.