
Figure 3. The glycolytic profile of HB cell lines is correlated to β‐catenin mutation.
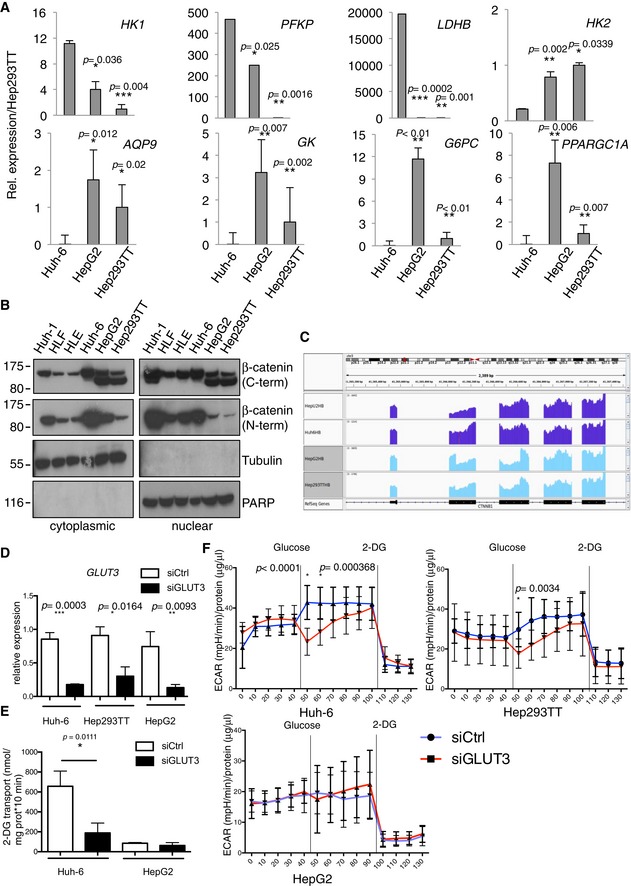
- Real‐time PCR using specific probes for glycolytic (HK1, PFKP, LDHB, HK2) and gluconeogenesis (AQP9, GK, G6PC, PPARGC1A) genes. Data show means ± s.d. (n = 3). P‐values were determined by Mann–Whitney test.
- Cytoplasmic and nuclear protein extracts isolated from the indicated cell lines were analyzed for β‐catenin expression by Western blot.
- Histograms of the RNAseq read counts for the CTNNB1 region in the embryonal and fetal cell lines.
- Real‐time PCR on GLUT3 after siGLUT3 or siCtrl transfection. Data show means ± s.d. (n = 3). P‐values were determined by Mann–Whitney test.
- Glucose uptake assay in HepG2 and Huh‐6 after transfection with siGLUT3 or siCtrl. Data show means ± s.d. (n = 5). P‐values were determined by Mann–Whitney test.
- Seahorse glycolytic assay on the three hepatoblastoma cell lines after transfection with siGLUT3 or siCtrl. Sequential measurements of ECAR from 10 replicates after the injections were done. Data show means ± s.d. Multiple t‐test was used.
Source data are available online for this figure.