
Figure 5. GLUT3 is a direct target of TCF4/β‐catenin.
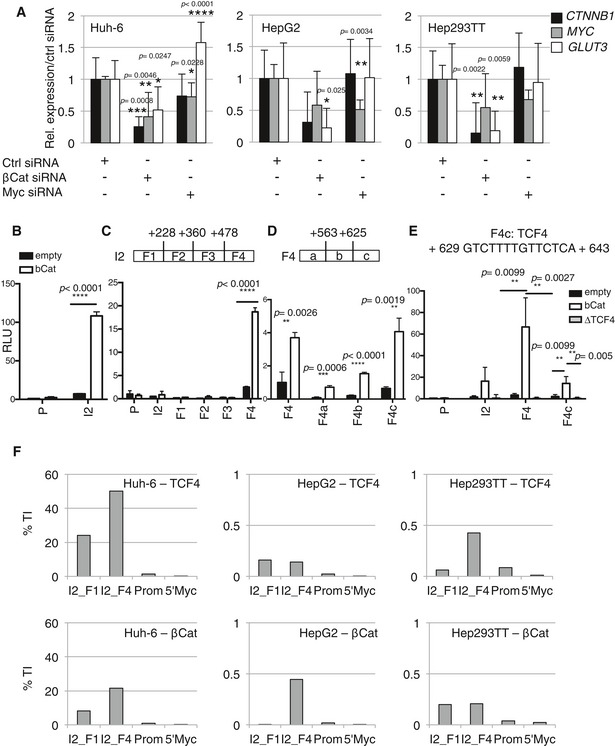
- Real‐time PCR analysis for CTNNB1, MYC, and GLUT3 expression in HB cell lines after siRNA transfection. Data show means ± s.d. (n = 3). P‐values were determined by Mann–Whitney test.
- The promoter region (P) and the intron 2 (I2) of GLUT3 were cloned into a luciferase reporter and measured as relative light unit (RLU) from HEK 293T cells transfected with the luciferase reporter and β‐catenin expressing vector or an empty vector as negative control.
- Luciferase activity was measured as in (B) with GLUT3 intron 2 separated into four different fragments.
- Luciferase activity was measured as in (B) with GLUT3 intron 2F4 divided into three fragments.
- Luciferase activity was measured as in (B). For I2, F4, and F4c, either wild‐type or a variant with a deletion of the TCF4 binding site (ΔTCF4) was used.
- Chromatin extract from the indicated cell lines was used for TCF4 (upper panel) or β‐catenin (lower panel) ChIP‐real‐time PCR. A 5‐kb region upstream of the MYC gene (5′ Myc) was used as negative control. Experiments were performed in triplicates per each condition and analyzed separately. See Appendix Fig S3A and B.