
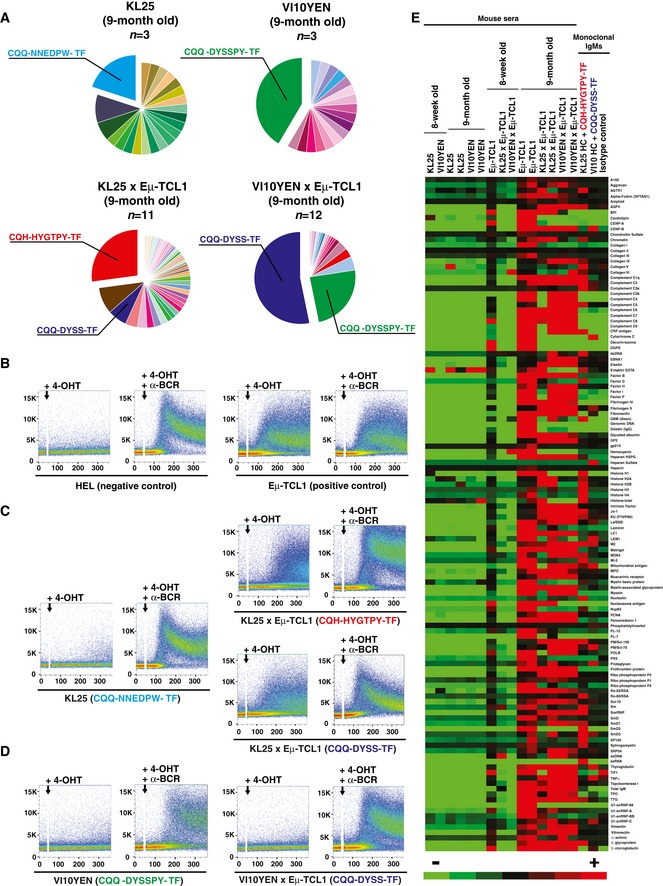
Figure 3. Pathogen‐specific B‐cell receptors drive chronic lymphocytic leukemia by light‐chain‐dependent cross‐reaction with autoantigens.
-
APie charts representing LCDR3 usage in 9‐month‐old KL25 (top left), VI10YEN (top right), KL25 × Eμ‐TCL1 (bottom left), and VI10YEN × Eμ‐TCL1 male mice (bottom right). n = 3 (KL25 and VI10YEN), 11 (KL25 × Eμ‐TCL1), 12 (VI10YEN × Eμ‐TCL1).
-
B–DRepresentative flow cytometry analyses of Ca2+ flux after activation of the ERT2‐BLNK fusion protein by 4‐OHT with or without an anti‐mouse light‐chain antibody (α‐BCR) in TKO cells expressing the indicated BCR (the CDR3 corresponding to the expressed light chain is indicated in parentheses). Addition of 4‐OHT with or without α‐BCR is marked by an arrow. Results are representative of three independent experiments.
-
ESera from 8‐week‐ and 9‐month‐old KL25, VI10YEN, Eμ‐TCL1, KL25 × Eμ‐TCL1, and VI10YEN × Eμ‐TCL1 male mice or monoclonal IgMs from leukemic KL25 × Eμ‐TCL1 and VI10YEN × Eμ‐TCL1 mice were screened for the presence of autoantibodies against a panel of 124 nuclear, cytoplasmic, membrane, and phospholipid autoantigens. The heat maps are based on the normalized fluorescent intensity of autoantibodies and are represented on a color scale range between +200 (red) and −200 (green) standard deviations.