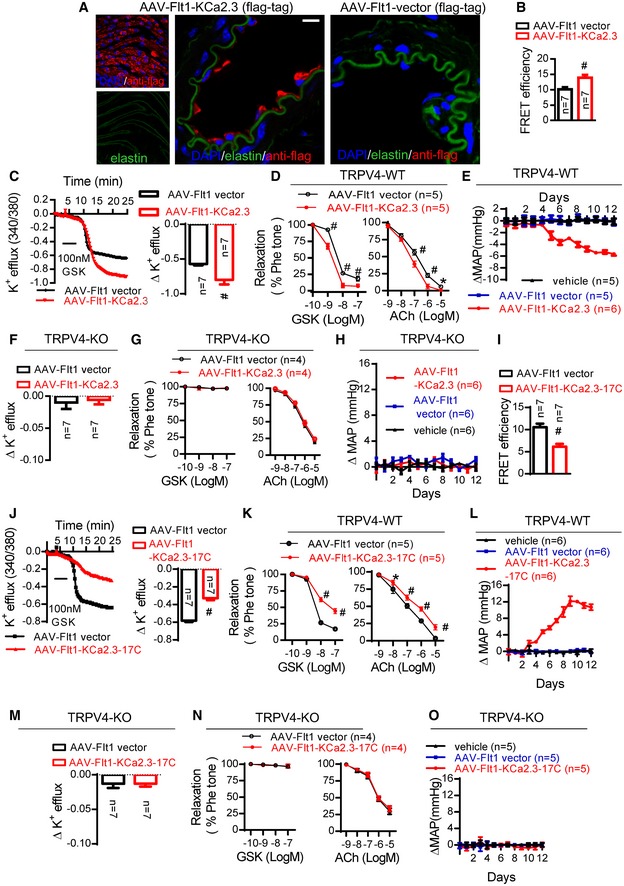
A–HMice were intravenously injected with AAV‐Flt1‐KCa2.3 and the AAV‐Flt1 vector served as a control. (A) Representative en face (left) and cross‐sectional (right) fluorescence images of AAV‐Flt1‐KCa2.3 or vector (flag‐tag) expression in AAV‐Flt1‐infected mice. Green, autofluorescence of elastin underneath the endothelium (excitation, 488 nm); red, anti‐flag. Scale bars, 10 μm. (B) Seven mice were tested for the effects of AAV‐Flt1‐KCa2.3 or vector in immuno‐FRET experiments (#
P < 0.0001 vs. control, unpaired t‐test). (C, F) K+ efflux from primary cultured ECs (#
P < 0.0001 vs. control, unpaired t‐test). (D, G) Vasodilation assays by wire myography (GSK1016790A (GSK) and ACh in freshly isolated arterial segments) (*P = 0.047, #
P < 0.0001 vs. control, two‐way ANOVA). (E, H) Time course of the changes in mean arterial pressure (∆MAP) in wild‐type (C–E) and TRPV4‐knockout (KO) (F–H) mice after tail injection of AAV‐Flt1‐KCa2.3, AAV‐Flt1 vector, or vehicle (injection solution).
I–OMice were intravenously injected with AAV‐Flt1‐KCa2.3‐17C; the AAV‐Flt1 vector served as the control. (I) Mice were tested for effects of AAV‐Flt1‐KCa2.3‐17C or vector with immuno‐FRET experiments (#
P < 0.0001 vs. control, unpaired t‐test). (J, M) K+ efflux from primary cultured ECs (#
P < 0.0001 vs. control, unpaired t‐test). (K, N) Vasodilation assays by wire myography (GSK1016790A (GSK) and ACh) in freshly isolated arterial segments) (*P = 0.004, #
P < 0.0001 vs. control, two‐way ANOVA). (L, O) Time course of the changes in mean arterial pressure (∆MAP) in wild‐type (J–L) and TRPV4‐knockout (KO) (M–O) mice after tail injection of AAV‐Flt1‐KCa2.3‐17C, AAV‐Flt1 vector, or vehicle (injection solution).

