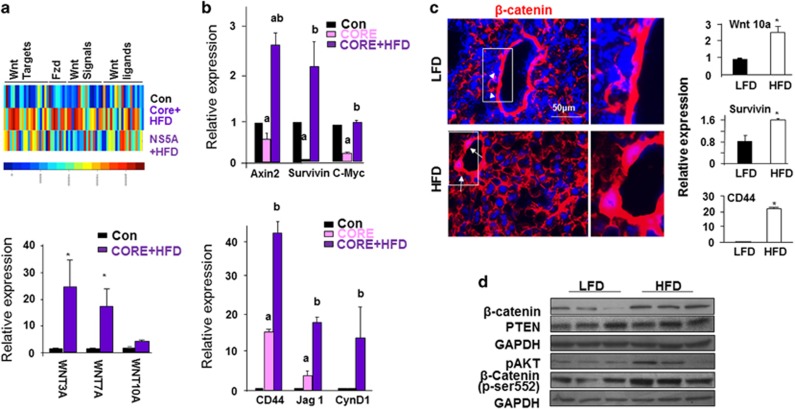
Figure 3.
Wnt signaling is induced in steatotic livers induced by HCV transgene and high fat feeding. (a) Top, Heat map of Wnt signaling gene changes observed in HFD-fed HCV core and NS5A transgenic livers vs controls. Animals were fed on HFD for 12 months. Scale bar for heat color is shown at the bottom where blue indicates low expression and red indicates high expression. Bottom, Quantitative PCR analysis for the expression of Wnt ligands in the same mice. n=5. * Indicates significant difference from controls at P⩽0.05. (b) Quantitative PCR analysis for the expression of Wnt target genes in the HFD-fed HCV core transgenic livers vs controls. n=5. a, Indicates significant difference from controls at P⩽0.05. b, Indicates significant difference from Core transgenic group at P⩽0.05. (c) Left, β-catenin staining in 3-month-old animals fed HFD vs LFD for 9 months. Arrow, nuclear staining of β-catenin in periductal cells in HFD mice; arrow head, membrane staining in periductal cells in LFD mice. Representative of three animals. Right, Quantitative PCR analysis of Wnt ligand and target genes. n=3–6. *P⩽0.05. (d) Western blot analysis of molecules in the PI3K/AKT and Wnt/β-catenin pathways in liver lysate from LFD- and HFD-fed mice.

