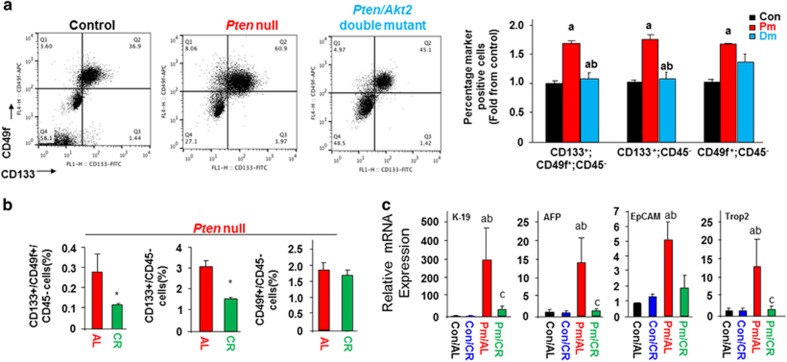
Figure 5.
Inhibiting steatosis blocks accumulation of TICs. (a) Representative flow cytometric (FACS) plot of TICs in Pten-null (Pm) vs Pten/Akt2 double mutant (Dm) mice using CD49f and CD133 to identify TICs. Left, Representative FACS plot; Right, quantitative analysis. n=4–5. * Significantly different from controls at P⩽0.05. 9-month-old mice. (b) Quantification of FACS analysis of TIC populations in AL (n=6) and CR (n=7)-fed Pten-null mice. * Significantly different from AL at P⩽0.05. 3-month-old animals were put on CR diet for 10 months. (c) Hepatic TIC markers are induced in Pm/AL mice and blocked with CR. n=6–11. a, significantly different from control. b, significantly different from Pm. P⩽0.05.

