Figure 7.
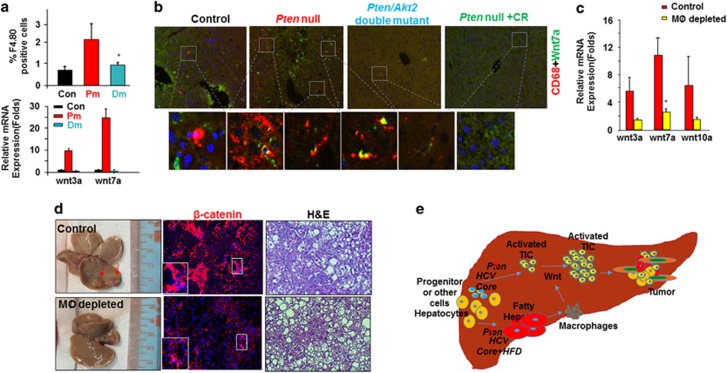
Macrophages are potential sources of Wnt induced by steatosis. (a) Top, increase of macrophage population in Pten-null mice and its inhibition by deletion of Akt2 to block steatosis. n=3–4. *significantly different from control at P⩽0.05. Bottom, increased expression of two Wnt ligands in Pten-null mice and its inhibition by deletion of Akt2. n=6. *significantly different from control at P⩽0.05. 5-month-old mice. (b) Immunohistostaining shows close localization of Wnt7a (green) and macrophage marker CD68 (red). 9–12-month-old mice. (c) Expression of Wnt ligands and liver phenotypes with macrophage (MØ) depletion. n=3–4. *significantly different from control at P⩽0.05. 7-month-old mice were given CLD or vehicle for 2 months. (d) Left, macroscopic images of livers from Pten-null mice with or without macrophage depletion. Arrow, tumor nodules developed in the Pten-null livers without macrophage depletion. Middle, β-catenin staining in livers from Pten-null mice with or without macrophage depletion. Right panel, microscopic images show tumors developed in the Pten mice without macrophage depletion (Control) vs lack of tumors with macrophage depletion. (e) Schematic representation of the working model that steatosis promotes tumor progression through Wnt.

